How to Use Pivots Points for Day Trading - Trend Indicators
How to use Pivot Points in forex day trading - learn to study and understand Pivot Points and how to trade Pivot Points Reversal signals explained simply.
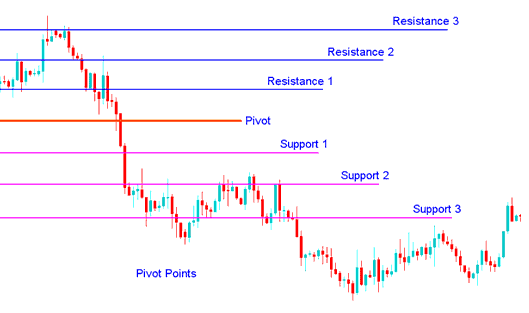
Pivot Points assist traders in identifying support and resistance zones based on the previous day's price movements.
These Pivot Points are helpful, using the highs, lows, and closing prices from past bars to estimate where support and resistance may be in the future.
Pivot points hint at main support and resistance spots. Add them to your currency charts. Prices often bounce off these lines. Traders use them to spot tops, bottoms, or trend shifts.
- Daily pivots point levels are calculated using the previous day's high, low, close which ends at 5.00pm EST(2100 GMT)
This indicator is displayed & shown below

Analysis in Forex Trading
The Main Pivot Point Sets the Key Level to Check the Market Direction.
Other support and resistance areas matter too. They help predict big price shifts in the market.
This technical indicator can be used in 2 ways
One way is to find out the general direction: if the pivot point goes up, the market is strong, and the opposite is also true. However, pivot levels are indicators for short-term trends, helpful for only one day until they must be calculated again.
Another method uses these points to enter and exit the markets. This trading indicator serves as a practical tool to pinpoint areas likely to trigger price movements.
Use these points and levels along with other types of technical analysis like moving averages, MACD, and the stochastic oscillator.
You can apply this indicator in several ways. Common ones include these basic uses.
Trend Direction: Combined with other trading analysis methods like overbought/oversold oscillators, volatility measurements, the central point may be useful in determining the general trending direction of the currency exchange market. Trades are only opened in direction of market trend. Buy signal occurs only when the market is above the central pivot point & sell trade signal occur only when the market is below the central pivot points.
Trading Price Breakouts: A buying signal materializes when the market forcefully pierces above the central pivot point or one of the established resistance levels (typically Resistance Level 1). Conversely, a selling signal is generated when the market breaks downward through the central point or one of the support zones (most commonly Support Zone 1).
Trend Reversals:
- A buy signal forms when market price moves toward a support level, gets very near to this point, touches this point, or moves only slightly through this level, and then reverses and moves back in the opposite market trend direction.
- A sell signal forms when market price moves toward a resistance level, gets very near to this point, touches this point, or only moves a little through this level, and then reverses and heads back in the opposite trend market direction.
Stop loss and/or Limit Profit Values Determined by Support/Resistance: This indicator may be potentially helpful in figuring out suitable stoploss and/or limit profit placements. For example, if trading a long break out above the Resistance 1 it might be practical to position a stop loss.
Combining with Moving Average Cross-over System
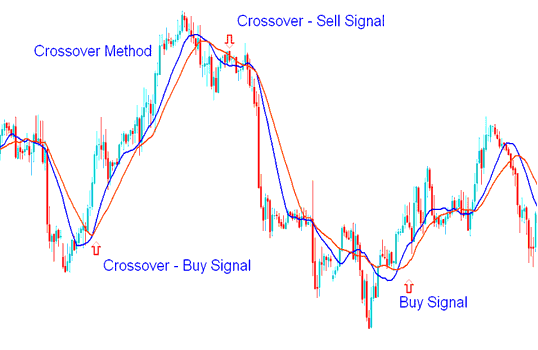
Pair the MA crossover with reversal signals. It confirms the shift in direction.
A trader can place an order once both indicators signal in the same direction.

Moving Average Cross-over Technique
This way of using Moving Averages can go with this indicator to make a plan for finding when to buy and sell.
To download this Pivot Points Indicator:
https://c.mql5.com/21/9/pro4x_pivot_lines.mq4
Once the trading indicator file has been retrieved, open it utilizing the MQL4 Language MetaEditor. Subsequently, finalize the indicator's integration by activating the Compile Button, which will then integrate it into your MT4 installation.
Please note: After you integrate this indicator into your MT4 Platform, it includes supplementary lines known as Mid Points. To eliminate these extra lines, access the MQL4 MetaEditor (shortcut key F4) and alter line 16 from:
Extern bool mid-pivot = true:
To
Extern bool mid-pivot = false:
Then, click Compile again, and then the indicator will show up and be seen just like it is on this website here.
More Topics & Lessons:
- Where can I find DJ 30 on MetaTrader 5 Software?
- Best Times to Trade XAU/USD in the Market
- Steps for Establishing a Trial MT4 Account within the MetaTrader 4 Environment
- What's the Bollinger Bandwidth Indicator?
- Setup Instructions for a Forex Linear Regression Acceleration Expert Advisor
- FX Major Pairs: Which Forex Pairs are Best for Daily Trading?
- Stock Index Market Open & Close Time
- Buying Strategies for Navigating an Upwards Market Trend
- What are Ehler RSI Buy and Sell Signals?
- Bollinger Percent B or Bollinger %b MetaTrader 4 Technical Indicator
