Japanese Candles Patterns
Japanese Candles were created in 18th century by the renowned rice trader called and named Homma Munehisa who used these candles to give a general overview of opening price, high, low and closing market price over a specified time period.
Candle charts helped a famous rice trader predict prices. He ruled the rice market. Later, he moved to Tokyo exchanges and built a big fortune with candle analysis. He won over 100 trades in a row.
Types of XAU/USD Charts
There are three types of charts used in XAUUSD trading charts: Line charts, bar charts & candles charts.
Line charts
Line charts show a continuous line that connects the closing prices of a XAUUSD, XAUUSD metal over a certain time period.
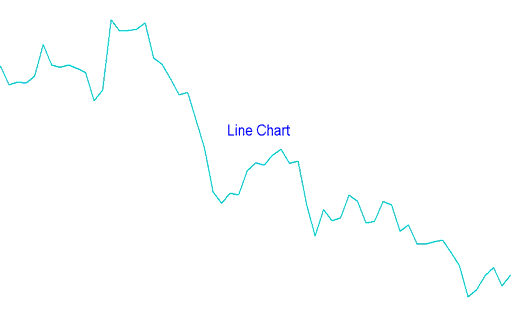
Gold Line Chart
Bar Charts
Bar charts - bar charts are displayed as a sequence of O.H.C.L. bars. OHCL represents OPEN HIGH LOW and CLOSE price. The Opening price is shown as a horizontal hyphen to the left and closing price as a horizontal hyphen to the right.
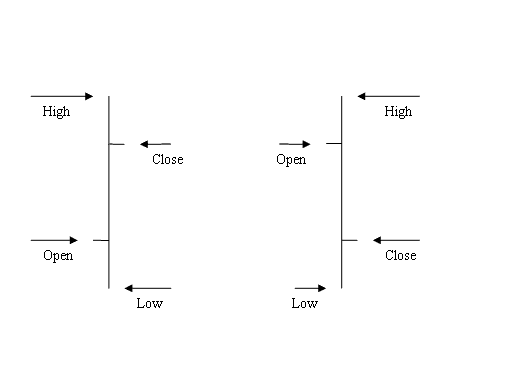
XAUUSD Bar Charts
The primary drawback of bar charts is their lack of visual appeal: consequently, most Gold traders refrain from utilizing these trading charts.
Candlestick Charts
Candle Charts - candle charts use the same price details as bar charts (open, high, low, and close price). But, these charts look better and are shown in a way that looks like a candle with lines on each end.
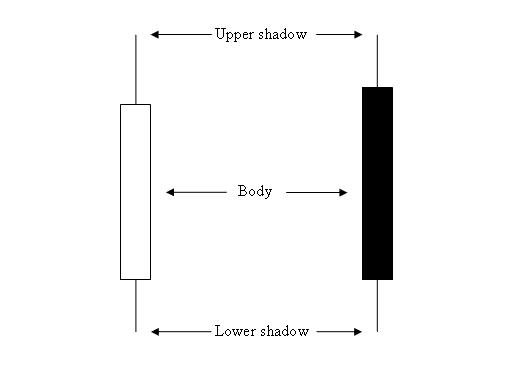
Gold Candles Charts
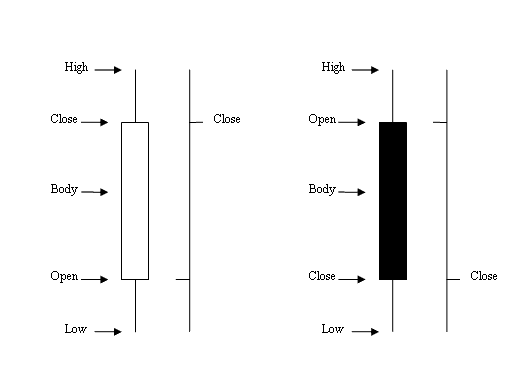
How to Analyze/Interpret Japanese Candles Charts
The rectangle part is called the body of the candle.
The high and low points are referred to as shadows and are represented by protruding lines. The colors may be blue or red.
- (Blue or Green Colour) - Shows prices moved up
- (Red Color) - Shows prices moved down
Platforms like MT4 color candlesticks to show direction. Blue or green means prices rise. Red means they fall.
When you use candlestick charts, it's simple to tell if the price went higher or lower, unlike when bar charts are used.
XAUUSD Candles Charts vs Bar Charts
Japanese candlestick charts include many patterns that technical analysts use for gold trades. These patterns have varied meanings, and common ones are:
- Marubozu and Doji candlesticks
- Spinning Tops candlesticks
- Reversal Patterns candlesticks
- Inverted Hammer and Shooting Star candles
- Piercing Line and Dark Cloud candles
- Morning Star and Evening Star candlesticks
These particular Japanese Candles patterns are the reason that Japanese candles charting is popular among traders, and that is the reason why this type of analysis is the most commonly used method for analyzing the prices of Gold. The analysis of these candles setup formations and setups for XAUUSD trading is the same as the analysis used for stock trading and Forex trading.
Drawing These Candles Charts on MT4 Software Platform
To add these candle charts in MT4, pick the drawing tools from the MetaTrader 4 toolbar as shown here.
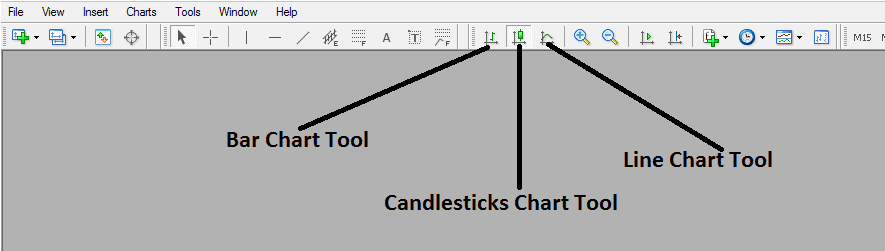
MT4 Charts Drawing ToolBar
To view this charts toolbar on MT4 go to "View" Next to file on the top left corner of the MetaTrader 4 Software/Platform, Click "View", Then Press "ToolBars", Then check the "Charts" Button. The above tool bar will appear.
Once the charts toolbar is displayed, you can select your preferred chart type as a trader. To switch to a bar chart format, click the bar chart button shown above. For a line chart format, select the line chart toolbar button, and for Japanese candlesticks, click the corresponding candlestick chart button.
Study More Instructions & Instructions:
- XAUUSD: Price Action Trading Strategies
- RSI Classic Bullish Divergence and RSI Classic Bearish Divergence Setup
- How XAU/USD Leverage Significantly Increases Gold Profits & XAUUSD Losses
- How to Draw Fibonacci Projection Levels on Trends & in Charts Analysis
- Examples of JP 225 Stock Market Trade Plans
- How to Create My One Page XAU/USD Plan Example Template Explained
- EURGBP Open Hours & EURGBP Close Time
- How to Set Alligator Trading Indicator in Trading Chart on MT4 Software Platform