Setting up Fib Expansion in MetaTrader 4 and Changing its Settings
The steps below show how to draw these levels, how to use this tool & how to change its settings.
How to Add This Tool on MT4
Steps: This tool isn't shown by default in MetaTrader 4 settings, if the button key is not shown on your MT4 software, (no need to download this tool) then locate "MT4 Line Studies Toolbar" shown & displayed below & follow the steps discussed below:
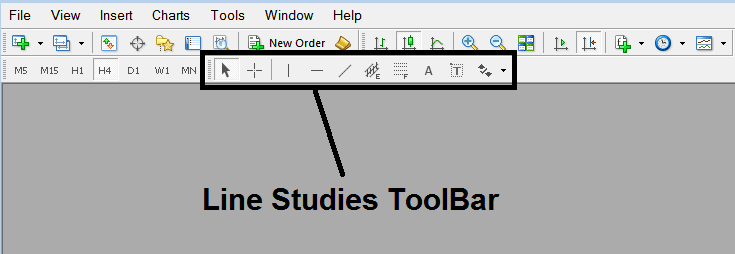
1. MT4 Line Studies ToolBar
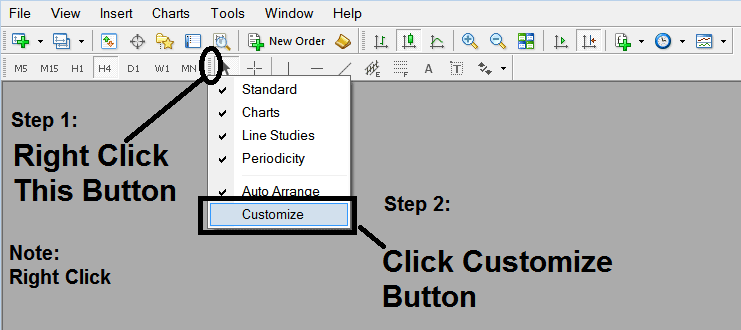
2. Customize Line Studies Tool bar
Right click the Customize button key (illustrated and shown below) >>> A drop-down menu appears, Choose Customize >>>
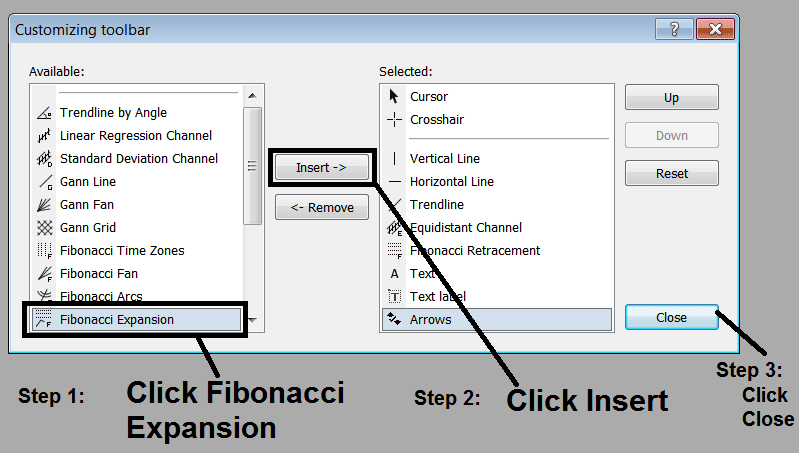
3. Place This Tool in MetaTrader 4
Choose the expansion tool from the popup window which will then appear >>> Click Insert button >>> Click Close. (Shown Below)
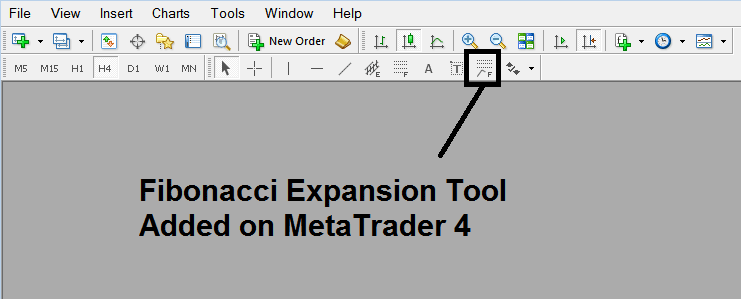
4. Fib Expansion Tool Added

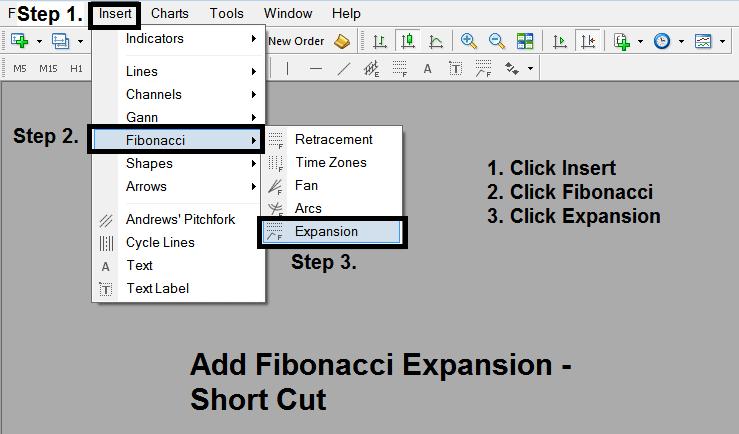
Short Cut of How to Add
You can also use this short-cut instead of the above technique, do this:
- Click "Insert Menu"
- Click Fibo
- Click Expansion
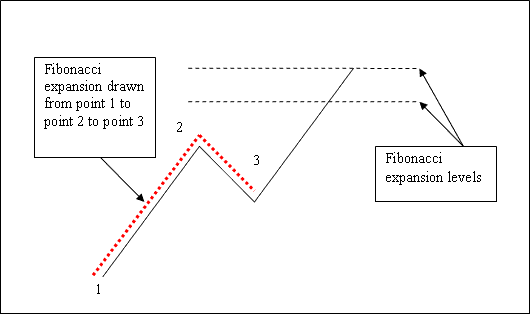
Steps on How to Draw Expansion
Steps. Once you've added this button, you can draw this tool by choosing it & drawing it on a xauusd chart. The Three points will be marked 1, 2 & 3, select the Fibo indicator, add the indicator tool on point 1 and while still holding down the mouse button drag the mouse upto point marked 2.
How to Shift This Indicator on a Trading Chart
Steps. Once you have drawn this indicator, you may need to move one chart point or another to the precise position where you precisely want. These 3 chart points are marked 1, 2 and 3 & these are used to change the indicator settings after this Fib tool has been placed on a chart.
To change the indicator settings: do this, double-click the indicator, it appears as dotted lines (shown above), 3 cursor points appear that are marked 1 2 3, you can then use these 3 points to adjust & fit the indicator accordingly to your chart (just click on the point you want and move it).
What is a Forex Trading Plan? - Written Forex Trading Plan Template
Alternatives: Automated EA Trading Robots or Copy Paste Trading Signals

