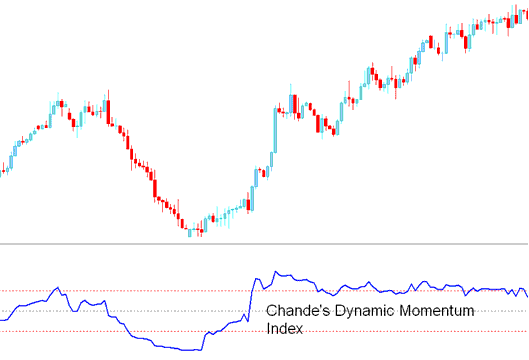
Chande Dynamic Momentum Index XAUUSD Technical Analysis & Chande DMI XAUUSD Signals
Developed by Tushar Chande
Chande DMI is similar to Welles Wilder’s RSI, however, there is one very important difference.
Relative Strength Index uses a fixed number of gold price periods while the Chande Momentum Dynamic Index uses a variable amount of gold price periods as market volatility changes.
The number of gold price periods used by this Momentum Index trading indicator decreases as market volatility increases. This allows the technical indicator to be more responsive to gold price changes.
The Chande DMI is more accurate than the RSI, has less whipsaws and is less Choppy
Gold Technical Analysis and How to Generate Trading Signals
Buy XAUUSD Signal
A buy signal is generated when DMI crosses above the 50 level mark.
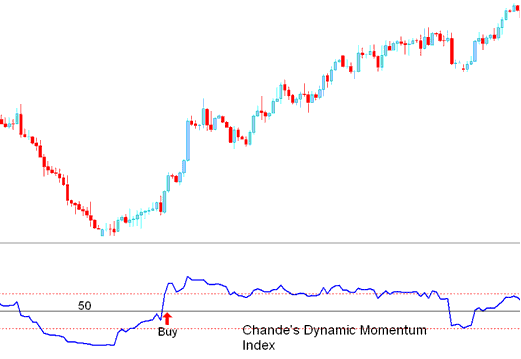
Buy Gold Signal
Sell XAUUSD Signal
A sell signal is generated when DMI crosses below 50 level mark.
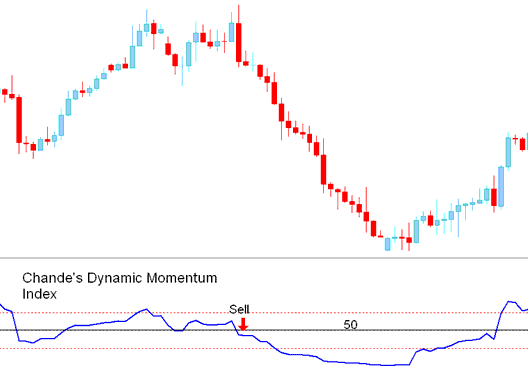
Sell Gold Signal


