Bollinger Band Analysis and Bollinger Bands Signals
Engineered & Built by John Bollinger
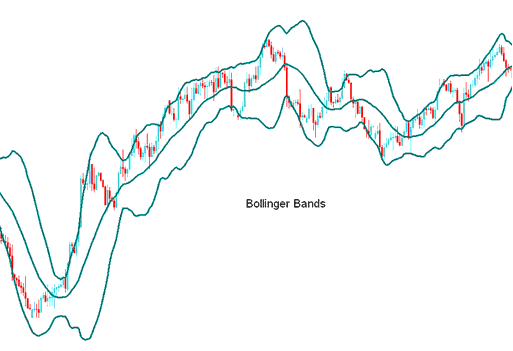
Bollinger Bands consist of three distinct lines: the central line itself is a 20-period Simple Moving Average (MA).
These bands are subsequently plotted at a specific deviation from the Moving Average, constituting the upper and lower boundary lines.
The placement of bands on a chart is influenced by the standard deviation, a technical indicator that measures market volatility, whether in the forex market or for specific currency pairs.
Since the market price volatility keeps on changing, the standard deviations will keep oscillating, and since Bollinger bands are plotted using the standard deviation method/calculation the distance calculation of the bands will keep on self adjusting themselves to volatility conditions.
When market volatility increases, the bands widen, while they narrow during less volatile periods.
The three bands are intended to capture most currency price movements. The mid-band, typically a 20-period simple moving average, serves as a foundational indicator of market trends.
This middle band sets the path for upper and lower bands. Their space from the middle depends on price swings. The upper band sits two standard deviations above. The lower one goes two below.
Forex Technical Analysis and How to Generate Trading Signals
- Bands provide a relative meaning of high & low
- Used to identify periods of high & low volatility
- Used to identify periods when prices are at extreme levels
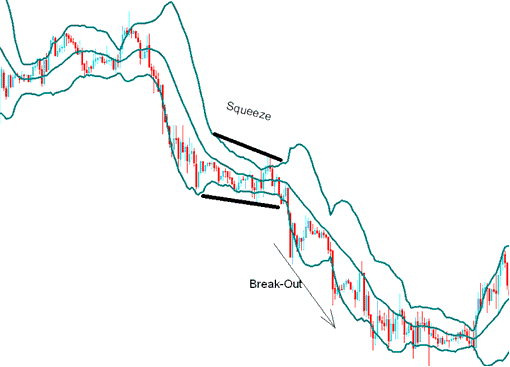
Consolidation - the Squeeze
When price volatility drops, the bands tighten. This signals consolidation. Usually, sharp price breakouts follow after the bands get tighter.
Consolidation Pattern
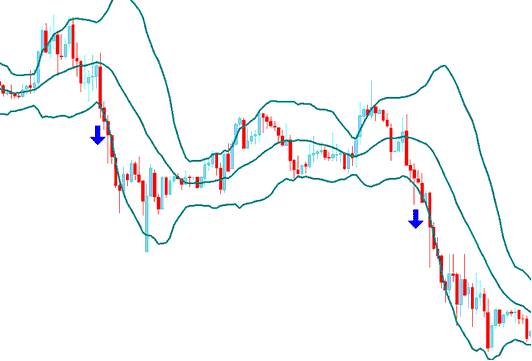
Continuation Forex Signal - the Bulge
Prices breaking past the upper or lower band signal the main trend will keep going.
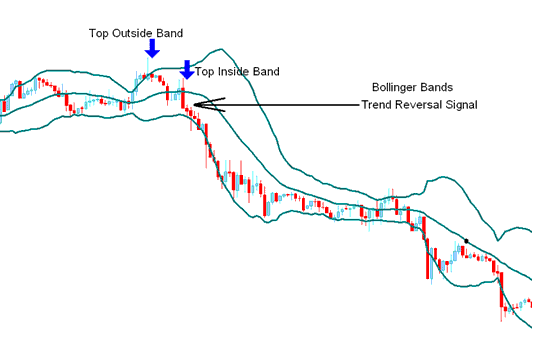
Reversal Signals - Double Top and Double Bottom Patterns
When lows and highs happen outside the bands, followed by lows and highs inside, the market trend is likely to change direction.
The Head Fake - Forex Whipsaw
Forex traders should be cautious of false breakouts, often referred to as whipsaws or head fakes.
After a market squeeze, prices often break out in one direction, misleading traders into assuming this trend will continue. However, this action frequently reverses quickly before making a more substantial breakout in the opposite direction.
Traders reacting quickly on the initial break-out commonly get caught up on wrong side of the price action, while those traders expecting a "false breakout" can quickly close out their original position and enter a trade in the direction of reversal. It is always good to combine Bollinger bands with other confirmation Technical Indicators.
Explore Further Training & Subject Areas:
- What's FX Bollinger Band Indicator?
- Learn XAUUSD & XAUUSD Strategies Lesson Tutorial
- Chande Trendscore Technical Analysis in Trade Forex
- Example of How is Free XAU USD Margin Calculated in MetaTrader 4 Platform Software?
- What is NZDSGD Spread?
- McClellan Oscillator Trading Methods Buy and Sell Trade Signal
- What is Gann Swing Oscillator Indicator?
- Apps and How to Use Apps on Android, iPad or iPhone
- MACD XAU/USD Analysis Buy and Sell Gold Signals Generation
- Trading MT5 Login to MT5 Account Login