Bilateral/Consolidation Chart Patterns Forex Trading
With bilateral/consolidation patterns the market can move in any direction after these patterns have formed. There are 2 types of consolidation patterns that form on Forex charts:
- Symmetric Triangles Patteerns - Consolidation chart patterns
- Rectangles Patteerns - Ranging market
Symmetrical Triangle Patterns - Consolidation Chart Setup Patterns
Symmetrical triangles patterns are patterns with converging trend lines that form a consolidation period in the price movement. The technical buy point from a symmetrical triangle chart pattern is the upside break, while a downside break is a technical sell signal. Ideally, a market breaks out from a symmetrical triangle prior to reaching the apex of the triangle chart pattern & the price breakout can either move upwards or downwards.
Trend Lines can be drawn connecting the lows & highs of the consolidation phase of these symmetrical triangle consolidation patterns, the trend lines formed are symmetrical and converge to make an apex. A price breakout should occur somewhere between 60-80% into the triangle pattern. An early or late break out is more prone to failure or whipsaws, & therefore less reliable. After a price breakout the apex forms the support and resistance levels for the price. Price that has broken out of the triangle trading setup should not retrace past the apex point. The apex point is used as a stop loss setting area for the open trades.
When these consolidation pattern setupss form we say that the market is taking a break before deciding the next price direction to take.
These forex consolidation patterns form when there is a tug of war between the buyers and the sellers and the market can't decide which way to continue.
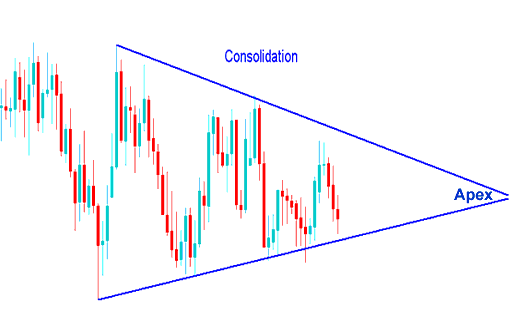
Forex Consolidation Pattern - Symmetrical Triangle Consolidation Chart Pattern
However, this consolidation chart pattern cannot go on forever & just like in a tug of war one side eventually wins, looking at chart below see how the consolidation pattern eventually had a price breakout and moved in one direction. Now, how do we make sure we are on the winning side of the trade?
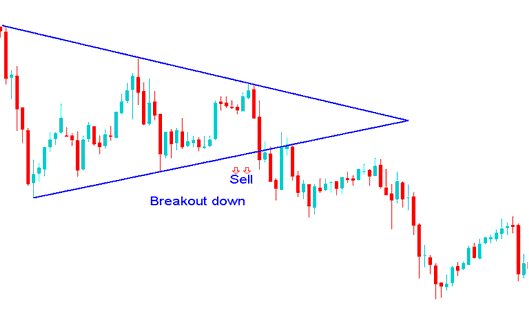
Price Break-out Downwards Sell Signal after a Consolidation Symmetric Triangle Chart Pattern
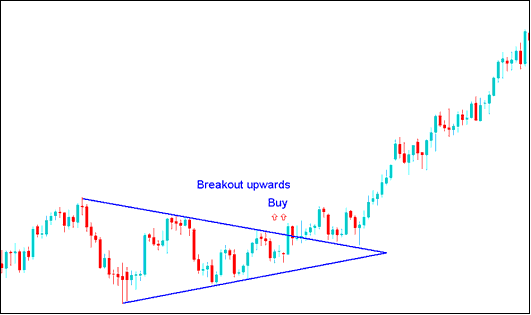
Break-out Up-ward Buy Signal after Forex Consolidation Chart Pattern

Now back to our question, how do we make sure we are on the winning side of the trade breakout?
Well we wait until the price moves past one of the consolidation lines and put buy or sell orders in that direction. After consolidating, If trading price breaks-out the upper line we buy, if it breaks out the lower line we sell.
Alternatively, if you don't want to wait out the consolidation chart pattern to play out, you can use pending orders. If you would like to know more about pending orders navigate to the topic: Stop Entry Order Types
The 2 types of pending stop order types used to trade consolidation patterns are:
- Buy Stop Order A pending order to buy at a level above the market price.
- Sell Stop Order A pending order to sell at a level below the market price.
These are pending orders set to buy above the market price or to sell below the market price.
Rectangle Chart Pattern
A rectangle consolidation pattern setup is a trading range with narrow price action which forms a consolidation phase in trading market. The price range is defined by 2 parallel trend lines which are horizontal and indicate the presence of support and resistance levels. This rectangle chart pattern is drawn on a trading chart using a rectangle, therefore the name rectangle chart pattern.
For this consolidation trading setup, price forms multiple highs and lows that can be then joined with horizontal trend lines that are parallel to each other. This rectangle pattern forms over an extended period of time giving this consolidation pattern setup its rectangle shape.
A break-out of price action from this consolidation pattern setup occurs when either of the horizontal line is penetrated & the price range of this rectangle pattern is broken. An upside price breakout is a forex buy signal. A downside price breakout is a forex sell signal.
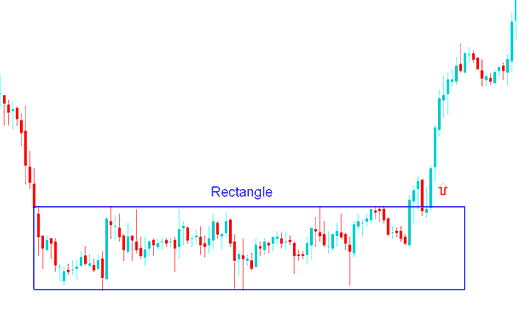
Rectangle Pattern Forex Consolidation Pattern
price breaks the consolidation range after sometime and continues to move upwards after an upwards market price breakout.
What is a Forex Trading Plan? - Written Forex Trading Plan Template
Alternatives: Automated EA Trading Robots or Copy Paste Trading Signals

