McClellan Histogram Expert Advisor Setup - Setting Up McClellan Histogram Expert Advisor
McClellan Histogram Expert Advisor Setup - Setting Up McClellan Histogram Expert Advisor - A trader can come up with an McClellan Histogram Expert Advisor based on the McClellan Histogram indicator explained below.
McClellan Histogram Expert Advisor rules can be combined with other Forex technical indicators to come up with other EA Robots that trade using rules based on two or more indicators combined to form a trading system.
McClellan Histogram Technical Analysis and McClellan Histogram Signals
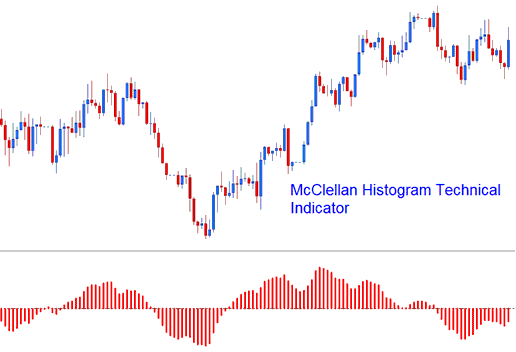
The McClellan Histogram is a graphical representation of the McClellan Oscillator and its signal line. This difference between the two is plotted as a histogram.
This is an oscillator indicator, the center line is the zero cross-over mark which is used to generate buy and sell signals.
McClellan Histogram - McClellan Histogram Expert Advisor Setup
FX Technical Analysis & How to Generate Signals
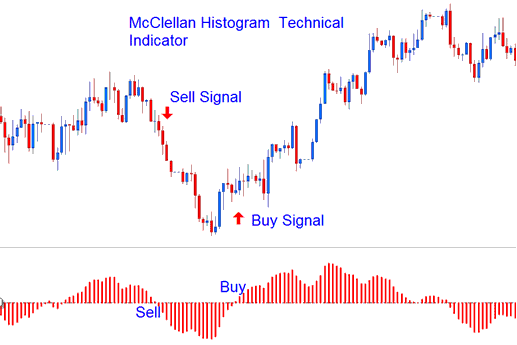
The Histogram is momentum indicator. Signals are generated using the center-line cross over method.
- Bullish signal- Above Zero
- Bearish Signal - Below Zero
There are two fundamental techniques for using this indicator to generate trading signals.
Zero-Level Crossover- When the histogram crosses above the zero a buy signal is generated. Otherwise, when the histogram oscillator crosses below the zero a sell signal is generated.
Technical Analysis - Forex McClellan Histogram Expert Advisor Setup
Divergence Trading - divergence trading between this indicator and the price chart can prove to be very effective Forex trading strategy in identifying potential trend reversal signals and trend continuation signals.


