Aroon Stock Indices Indicator Technical Analysis & Aroon Stock Indices Indicator Signals
Created by Tushar Chandes
This technical indicator is used to determine if a instrument is trending or not.
It is also used to indicate how strong the trend is.
It is also used to identify the beginning of a trend, the name its name which means morning or dawn.
This technical indicator has two lines:
- Aroon UP Indicator
- Aroon DOWN Indicator
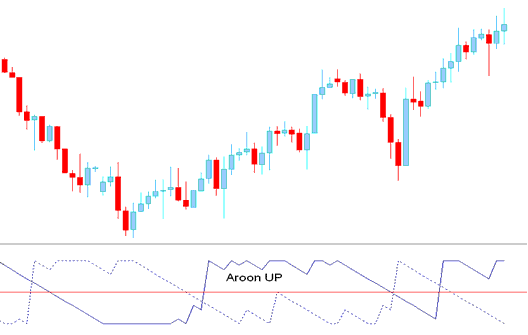
Aroon UP Indicator
Percentage of time between the start of a time period and the highest point that price has reached during that period.
If stock index price sets a new high, Aroon UP Indicator will be 100 - for each new high it will stay at 100. However, if stock index price moves down by a certain percentage, then that percentage is subtracted from the 100 and Aroon UP Indicator starts to move down. This means that if Aroon UP Indicator stays at 100 then price is making new highs but when it starts to move down then price is not making new highs.
If however price is making new lows for a particular price period then Aroon UP Indicator will be at zero
Calculation
Aroon UP Indicator is a percentage of time between price period and highest point.
If you use 10 stock index price periods for calculation:
Example 1: Highest price was 1 day ago
Then if the highest point was yesterday, i.e. 1 day before then
10 stock index price periods minus 1 day= 9
9/10 in percent terms = 90
Aroon UP Indicator will be at 90
Example 2: Highest price was 5 days ago
If the highest point was 5 days ago then
10 stock index price periods minus 5 = 5
5/10 in percent = 50
Aroon UP Indicator will be at 50

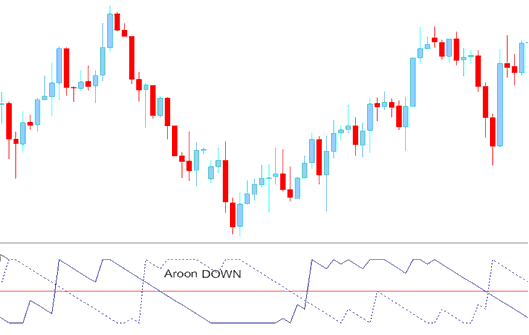
Aroon DOWN Indicator
This is calculated the same as Aroon UP Indicator but this time using the lowest point instead of highest point.
When a new low is set Aroon DOWN Indicator is at 100 & when a new high is set it'll move to zero.

Stock Indices Analysis & Generating Indices Signals
This technical indicator uses the 50% level to measure momentum of the trend.
Buy Stock Indices Signal and exit signal
Aroon UP Indicator above 50 is a technical buy signal
Aroon UP Indicator dipping below 50 is an exit signal if you had opened a buy stock index trade.
Sell Stock Indices Signal and exit signal
Aroon DOWN Indicator below 50 is a technical sell stock index trade signal.
Aroon DOWN Indicator rising above 50 is an exit signal if you had opened a sell trade.
Buy & Sell Stock Indices Signals
What is a Forex Trading Plan? - Written Forex Trading Plan Template
Alternatives: Automated EA Trading Robots or Copy Paste Trading Signals

