Chaikins Money Flow Stock Indices Analysis & Money Flow Stock Indices Signals
Created by Marc Chaikin
This an oscillator which measure the Accumulation/distribution of money that is flowing into and out of a stock indices.
The indicator is based on the fact that the nearer the closing price is to the high of the price, the more the accumulation of the stock indices.
Also the nearer the closing price is to the low of the price, the more the distribution of the stock indices.
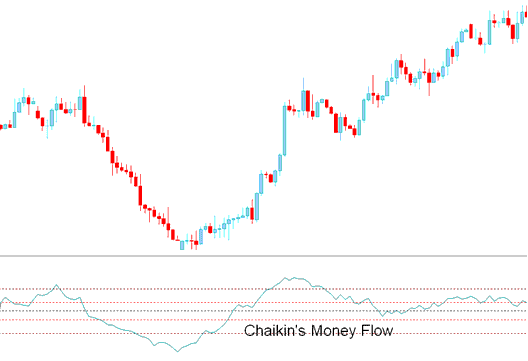
Chaikins Money Flow will be positive if stock price consistently closes above the bar's midpoint with increasing volume.
However, if stock price consistently closes below the bar's midpoint with increasing volume the indicator will be negative.
Stock Indices Analysis & How to Generate Signals
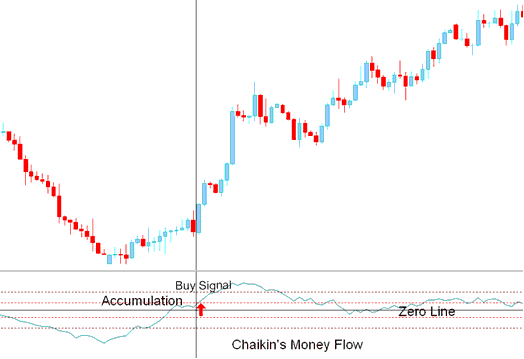
Buy Stock Indices Signal
A crossover of above zero signifies accumulation of a stock indices. A value of above +10 is a buy/bullish signal. Values above +20 signify a strong upward trending market.
Buy Indices Signal
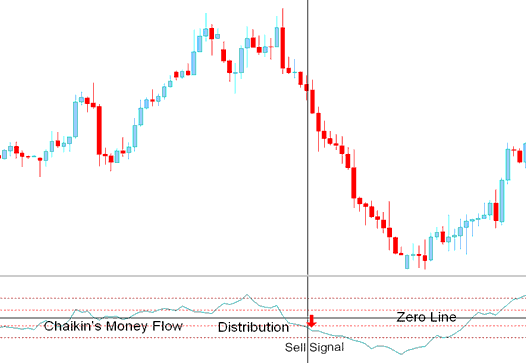
Sell Stock Indices Signal
A Zero line cross of below zero signifies distribution of a stock indices. A value of below -10 is a short/sell signal. Values below -20 signify a strong downward trending market.
Sell Indices Signal

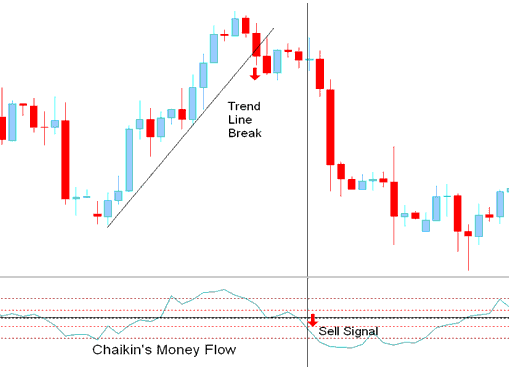
Trend Line break with Chaikin’s money Flow
The money flow can be used to confirm trend line breaks out or support/resistance level breaks-out.
If stock price breaks an upward trend line, Stock traders should then wait for a confirmation signal from the indicator values of below -10.
Trendline Break
If stock price breaks an downward trend line, Stock traders should then wait for a confirmation signal from indicator values of above +10.
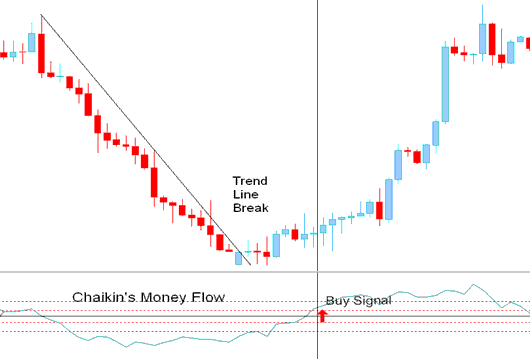
Trendline Break
Divergence Indices
A divergence between this indicator & stock price often signals a pending reversal in market direction. However as with all divergences its best to wait for confirmation signals before trading the divergence.
A bullish divergence signal occurs when price makes a lower low while the Chaikins Money Flow makes a higher low.
A bearish divergence signal occurs when price makes a higher high while the Chaikins Money Flow makes a lower high.
What is a Forex Trading Plan? - Written Forex Trading Plan Template
Alternatives: Automated EA Trading Robots or Copy Paste Trading Signals

