Divergence Stock Indices Setups
Divergence is one of the trade set ups used by Stock traders. It involves looking at a chart and one more indicator. For our example we shall use the MACD indicator.
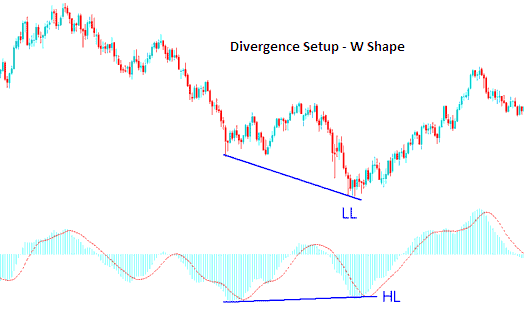
To spot this trading setup find two chart points at which stock index price makes a new swing high or a new swing low but MACD indicator doesn't, indicating a divergence between stock index price & momentum.
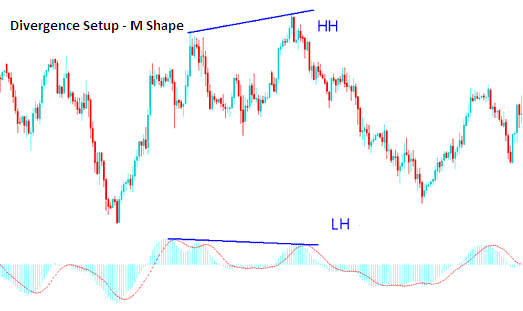
To look for divergence we look for two chart points, 2 highs that form an M shape on the Stock Indices Trading chart or two lows that form a W-Shape on the Stock Indices Trading chart. Then look for the same M-shape or W-Shape on the indicator you use to trade.
Example of a Indices Trade Divergence Trade Setup:
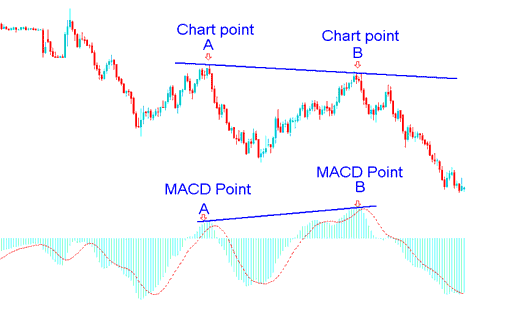
In the stock index chart below we identify 2 chart points, point A and point B (swing highs). These two points form an M shape on the stock index price chart.
Then using MACD indicator we check the highs made by the MACD, these are the highs that are directly below Chart points A & B.
We then draw one line on the Stock Indices Trading chart & another line on the MACD indicator.
Drawing Divergence Stock Indices Lines
The chart above displays example of one of the 4 types of divergences, the one above is known as hidden bearish divergence, one of the best type to trade. Types of divergences are covered in the next tutorial.
How to spot divergence
In order to spot Stock Indices Trading diverging signal we look for the following:
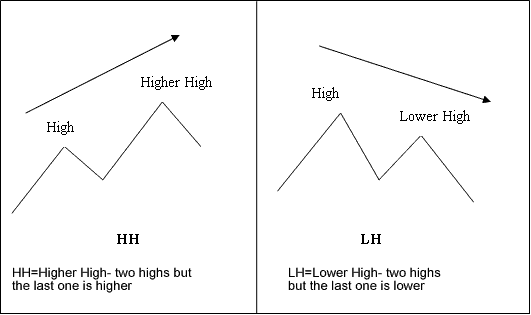
- HH=Higher High- 2 highs but the last one is higher
- LH= Lower High- two highs but the last one is lower
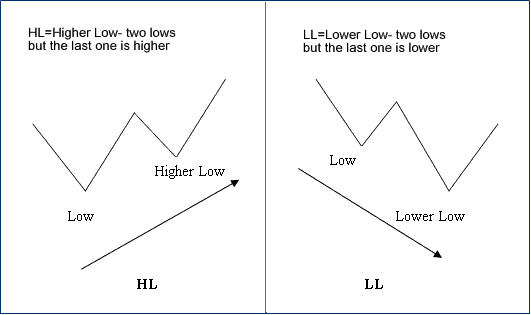
- HL=Higher Low- two lows but the last one is higher
- LL= Lower Low- two lows but the last one is lower
First let us look at the illustrations of these trading terms:
M-shapes dealing with Stock Indices price Highs
W-Shapes dealing with Indices price lows

Example of M Shapes
Examples of W Shapes
Now that you have learned the divergence trading terms that are used to explain trading set-up. Let us look at the two types of divergences and how to trade these chart setups.
There two types are:
- Classic Stock Trade Divergence
- Hidden Indices Trade Divergence
These 2 set ups are described on the following guides below
What is a Forex Trading Plan? - Written Forex Trading Plan Template
Alternatives: Automated EA Trading Robots or Copy Paste Trading Signals

