Kaufman Efficiency Ratio Stock Indices Analysis and Kaufman Efficiency Ratio Signals
Created by Perry Kaufman. Described in his book entitled "New Trading Systems & Techniques".
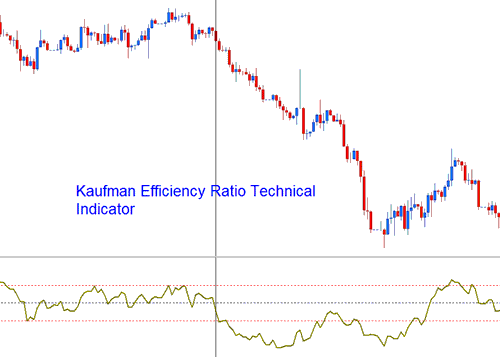
The Kaufman Efficiency measures the ratio of the relative market speed in relation to volatility. The Kaufman efficiency is often used by Stock traders as a filter to help avoid trading when the market is "choppy" or flat ranging markets. The indicator also helps to identify smoother market trends. This is an oscillator indicator that oscillates between +100 and -100, where zero is the center point. +100 is upwards trending market & -100 is downward trending markets.
Kaufman Efficiency Ratio
The Efficiency indicator is calculated by dividing the net change in price movement over an n number of periods by the sum of all the bar-to-bar price changes taken as a absolute values over these same n periods.
Stock Indices Analysis and How to Generate Trade Signals
The Kaufman is used to generate signals as follows:
The smoother the manner in which the market is trending then the greater the Efficiency Ratio shown by the indicator. Efficiency Ratio value readings of around zero indicate a lot of inefficiency or "choppiness" in the market stock trend movements (ranging stock markets).
- If the Efficiency Ratio shows a reading of +100 for a stock indices instrument, then that stock indices instrument is trending upward with perfect efficiency.
- If the Efficiency Ratio shows a reading of -100 for a stock indices instrument, then that price is trending downwards with perfect efficiency.
However, it's almost impossible for a market stock trend to have a perfect efficiency ratio since any retracement movement against the current trend direction during the time period being used to calculate the indicator would decrease the efficiency ratio.

Bullish/Buy Signal
Efficiency Ratio values above +30 indicate a smoother upward trend.
Buy signal is generated above center-line mark.
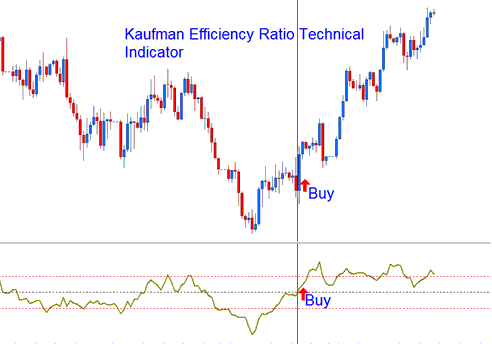
Buy Signal
Bearish/Sell Signal
Efficiency Ratio values below -30 indicate a smoother downward trend.
Sell Signal is generated below zero center-line mark.
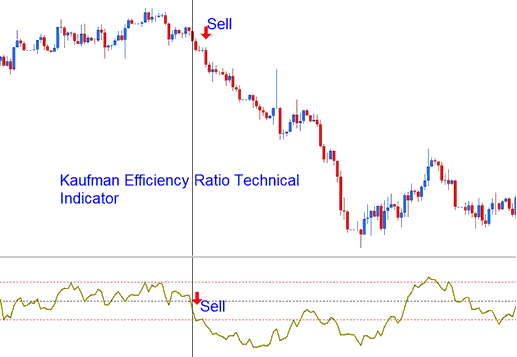
Sell Signal
However, it is good you experiment with other values to determine the most appropriate levels for the stock indices instrument being traded and the value that is the best for your stock index methodology that you're using.
What is a Forex Trading Plan? - Written Forex Trading Plan Template
Alternatives: Automated EA Trading Robots or Copy Paste Trading Signals

