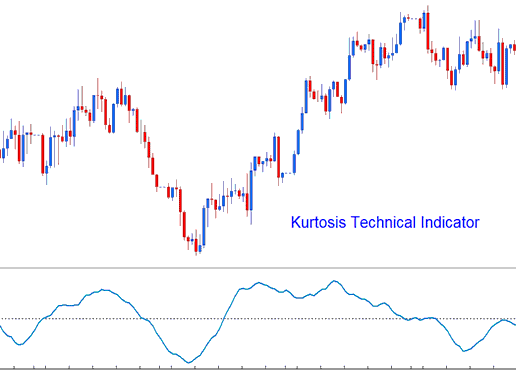
Kurtosis Technical Analysis & Kurtosis Signals
This technical indicator is used to help determine the sentiment of the stock market.
It is calculated in 3 parts.
- Kurtosis portion
- Fast Kurtosis
- Fast/Slow Kurtosis
The Kurtosis portion is calculated using the formula:
K = n-periods momentum - n-periods momentum of 1 bar before (current stock price bar’s momentum value minus the previous stock price bar’s momentum value)
The Fast Kurtosis portion is calculated using the formula:
FK = n-periods moving average of K
Fast/Slow Kurtosis portion is calculated using the formula:
FSK = n-periods moving average of FK
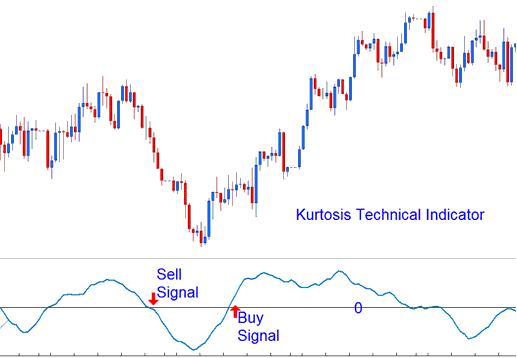
Technical Analysis & Generating Signals
Bullish Signal - A buy signal is generated when indicator crosses above zero.
Bearish Signal - A sell signal is generated when indicator crosses below the zero.
Analysis in Indices Trading
What is a Forex Trading Plan? - Written Forex Trading Plan Template
Alternatives: Automated EA Trading Robots or Copy Paste Trading Signals


