Linear Regression Slope Stock Indices Analysis & Linear Regression Slope Signals
Linear Regression Slope indicator calculates slope/gradient value of regression lines which involves the current stock price bar & the previous n-1 price bar (where n = regression periods)
This Indicator calculates this value and updates it for each stock price candlestick loaded in the stock price chart.
The Indicator is calculated from the Linear Regression Stock Index Indicator. The linear regression plots the trend of the price chart over a specified duration of time and this market trend is determined by plotting a Linear Regression Trendline using the "least squares fit" method. The slope of this trend line is then calculated and this forms the linear regression.
Linear Regression Slope
The slope values are then smoothed by multiplying the raw slope indicator values by 100 and then dividing this value by the price
Linear Slope Regression = (raw value of slope * 100 / price).
The smoothing of the slope values is essential when comparing markets that are volatile & trade within wide stock price ranges for each stock price candle. The smoothed slope value will show the percent change in the stock price per every candlestick used to calculate the regression (best fit) line.
Indices Analysis & Generating Signals
- If the smoothing of the slope is 0.30, then the regression line is rising & adjusting at a rate of 0.30% for every candlestick.
- If the smoothing of the slope of -0.30, then the regression line is going down & adjusting at a rate of -0.30% for every candlestick.
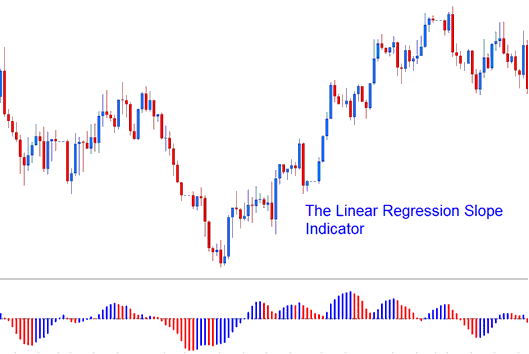
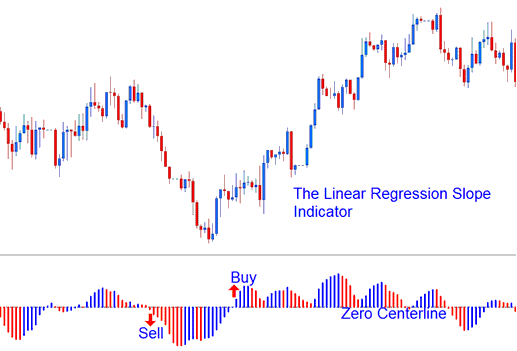
The regression slope is displayed as a bi-color histogram that oscillates above and below zero center line. The center-line that's used to generate stock trading signals is set at the 0 level.
- A rising slope (greater than the previous value of 1 candlestick ago) is displayed in the Blue/Upwards Slope color,
- A declining slope (lower than the previous value of 1 candlestick ago) is displayed in the Red/Downwards Slope color.
Technical Analysis in Indices Trading
What is a Forex Trading Plan? - Written Forex Trading Plan Template
Alternatives: Automated EA Trading Robots or Copy Paste Trading Signals


