MACD Technical Analysis Buy & Sell Signals
Since the MACD indicator uses 26 and 12 EMA to plot, we shall compare these two EMAs with the MACD indicator to determine how these buy and sell signals are generated.
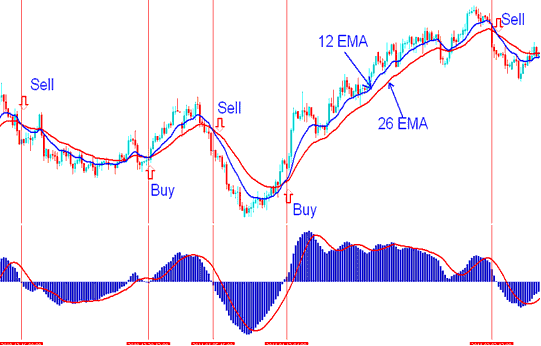
MACD Stock Index Indicator - Example of MACD Indicator
The MACD indicator is a leading indicator meaning it generates signals that are leading compared to price action as opposed to lagging indicators that lag behind the price.
Buy Trade
A buy trade is generated when there's a MACD fast line crosses above signal line. However, as with any leading indicator these trading signals are prone to whipsaws/fake-outs.
To eliminate the whipsaws it's good to wait for confirmation of the buy or sell signals. The confirmation signal is when the two lines cross above the zero mark, when this happens the buy generated is a reliable trading signal.
In the example illustrated below, the Moving average indicator generated a buy signal, before price started to move up. But it wasn't until the MACD moved above the zero line that the buy signal was confirmed, and the Moving Averages also gave a crossover signal. From experience it's always good to buy after both the MACD lines move above zero center line mark.
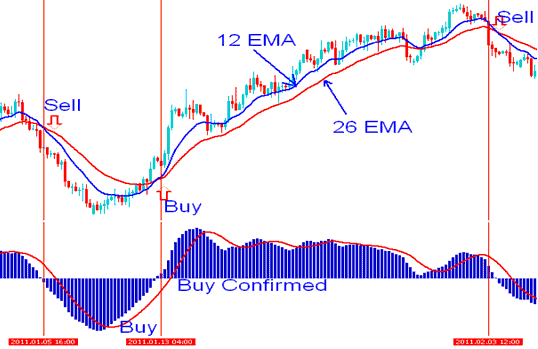
Where to Buy using MACD Stock Index Indicator - Buy Signal
Sell Trade
A sell trading signal is generated when there's a MACD fast line crosses below signal line. However, just like the buy signal, these are also prone to whipsaws/ fake outs.
To eliminate the whipsaws it is good to wait for confirmation of the sell signal. The confirmation is when the two lines cross below the zero mark, when this happens the sell generated is a reliable trading signal.
In the example illustrated below, the Moving average generated a sell confirmed after MACD moved below the zero line at the same time that the Moving Averages gave a crossover trading signal.
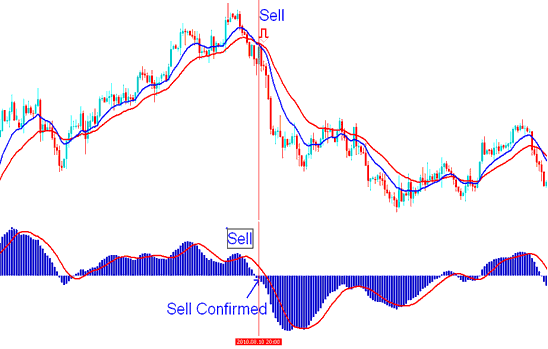
Where to Sell using MACD Stock Index Indicator - Sell Signal
What is a Forex Trading Plan? - Written Forex Trading Plan Template
Alternatives: Automated EA Trading Robots or Copy Paste Trading Signals


