Parabolic SAR Indices Analysis and Parabolic SAR Stock Indices Signals
Developed by J. Welles Wilder.
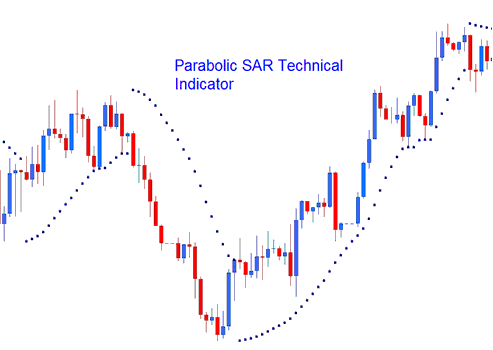
The Parabolic SAR is used to set trailing price stops. This indicator is usually referred to as the 'SAR' (stop-and-reversal) and it is used to follow stock index price action closely.
- In an Uptrend, the stop and reversal will trail below the stock market price
- In a downward stock trend, the stop and reversal will trail above the stock market price
Indices Analysis and How to Generate Trading Signals
This indicator provides excellent exit points.
Exit Trade Signal for Buy trades
Traders should close long trades when price falls below the technical indicator.
If you are trading long i.e. The price is above the stop and reversal, the SAR will move up every day, regardless of the direction that stock index price action is moving. The movement of the indicator depends on the number of pips that stock index prices move. When the SAR changes the direction then the stock market trend also changes to down. This generates the exit signal for long trades.
Exit Stock Trade Signal for Sell trades
Traders should close short trade positions when price rises above the technical indicator.
If you are trading short i.e. The price is below the stop and reversal, the SAR will move down every day, regardless of the direction that stock index price action is moving. The movement of the indicator depends on the number of pips that stock index prices move. When the SAR changes the direction then the stock market trend also changes to up. This generates the exit signal for short trades.
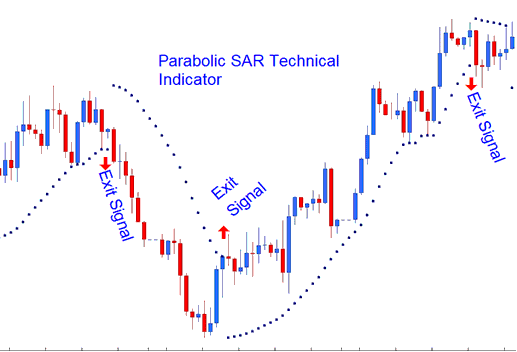
Exit Signal for Buy and Sell trades
What is a Forex Trading Plan? - Written Forex Trading Plan Template
Alternatives: Automated EA Trading Robots or Copy Paste Trading Signals


