Place Parabolic SAR Indicator on Chart on MetaTrader 4
This learn stock indices tutorial will explain how to place the Parabolic SAR, (Stop & Reverse), on the Chart on the MetaTrader 4 platform. For Technical analysis: Technical analysis of stock indices Parabolic SAR.
How to Place Indicators in MetaTrader 4 Charts
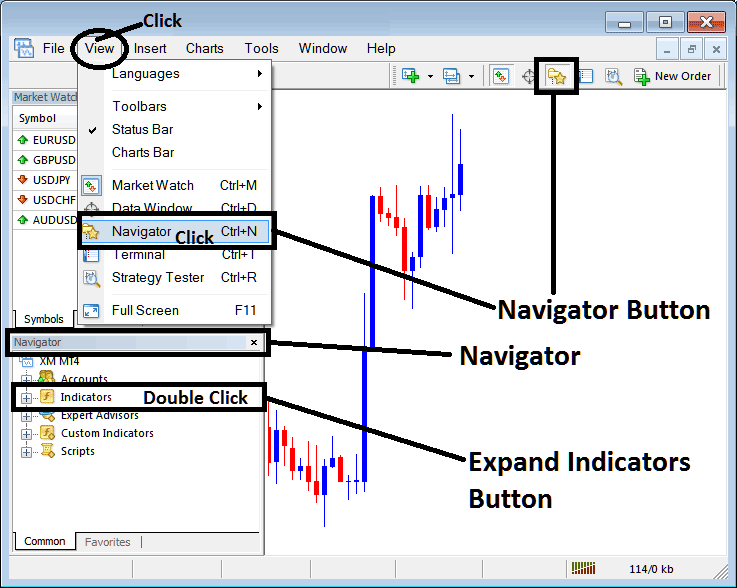
Step 1: Open The Platform Navigator Window
Open Navigator window as shown & illustrated below: Go to "View" menu (click on it), then choose the "Navigator" window (click), or From Standard Tool Bar click the "Navigator" button or press keyboard short cut keys "Ctrl+N"
On the Navigator window, choose 'Indicators', (Double-Click)
Step 2: Expand the Indicators Menu on the Navigator
Expand the menu by clicking the expand button (+) or doubleclick the "indicators" menu, after this the button key will then now appear as (-) & will now be shown as a list as shown below.
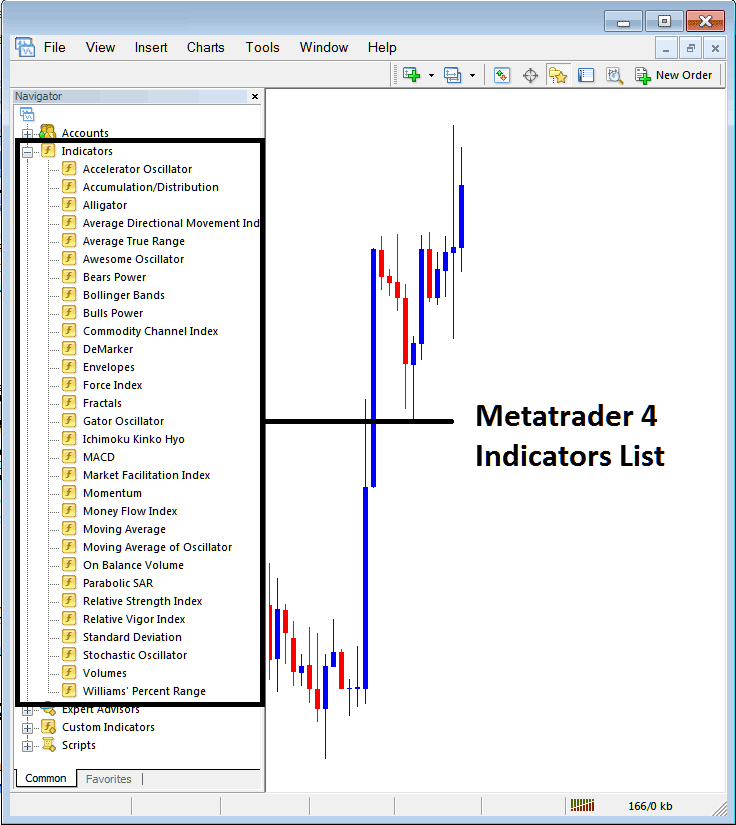
From the Above window you can then place any technical indicator you want on the chart.

Placing Parabolic SAR on a Chart
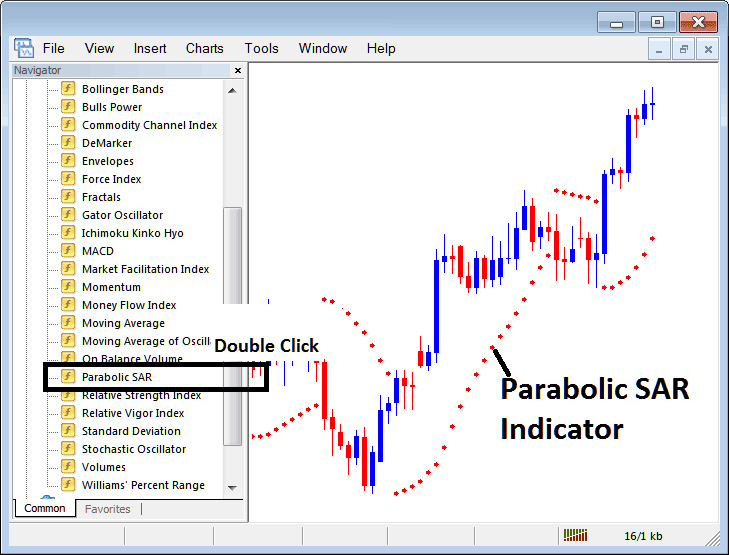
Step 1: Select the Parabolic SAR button on the MetaTrader 4 list of technical indicators as pictured below:

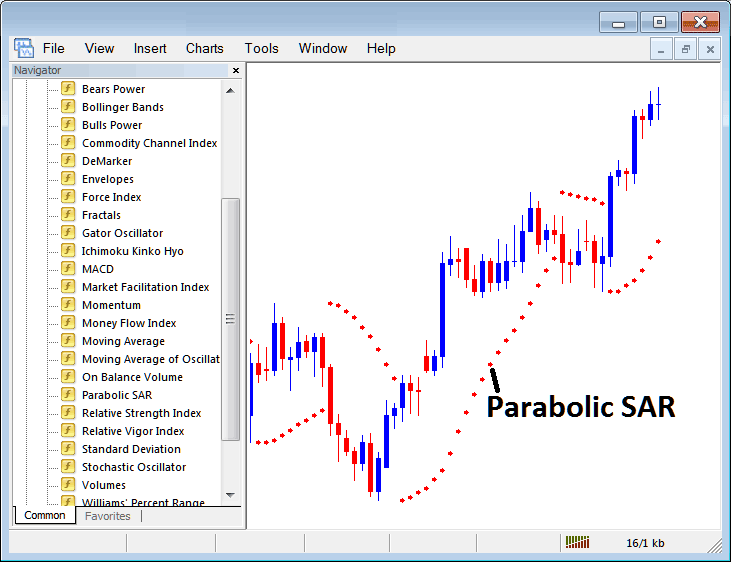
Step 2: Double click the Parabolic SAR Button Key, & click okay to place the technical indicator on the trading chart as shown below:
Edit Parabolic SAR Indicator Settings
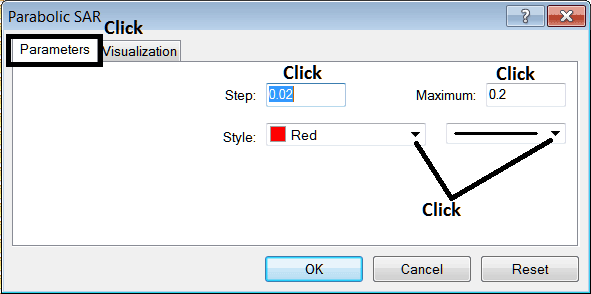
To Alter the Settings, right click on Parabolic SAR Stock Index Indicator, select properties and then edit the settings using the pop up menu that appears and then click ok button after you have changed settings.
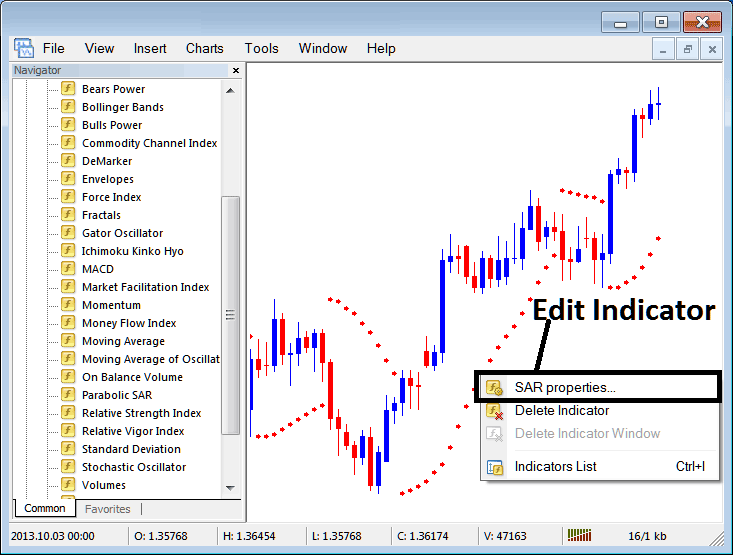
The following popup window panel pops up and the Trading Technical Indicator settings can be edited from this pop up.
What is a Forex Trading Plan? - Written Forex Trading Plan Template
Alternatives: Automated EA Trading Robots or Copy Paste Trading Signals

