Bullish Stock Index Candle Pattern Setups & Bearish Stock Index Candlestick Patterns
Bullish Candle Patterns Tutorial and Bearish Candlestick Setups Tutorial
Reversal candle stick patterns occur after an extended prior trend. Therefore, for a candlestick pattern setup to qualify as a reversal stock indices setup there must be a prior trend.
The reversal candle stick patterns are:
- Hammer Candle Setup & Hanging Man Candlestick Pattern
- Inverted Hammer Candlestick Pattern and Shooting Star Candle Pattern
- Piercing Line Stock Candlestick Pattern & Dark Cloud Cover Candlestick Pattern
- Morning Star Candles and Evening Star Candles
- Engulfing Candles Patterns
Hammer Candle Setup & Hanging Man Candlestick Pattern
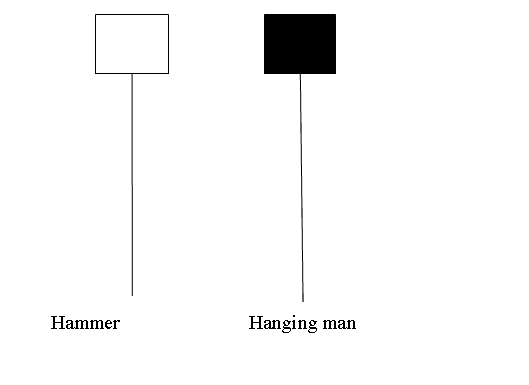
Hammer Candle Pattern & Hanging Man Candlestick Pattern candlesticks look alike but hammer is bullish reversal pattern and hanging man is a bearish reversal pattern.
Hammer Candle Setup & Hanging Man Candlestick Pattern
Hammer Candlestick
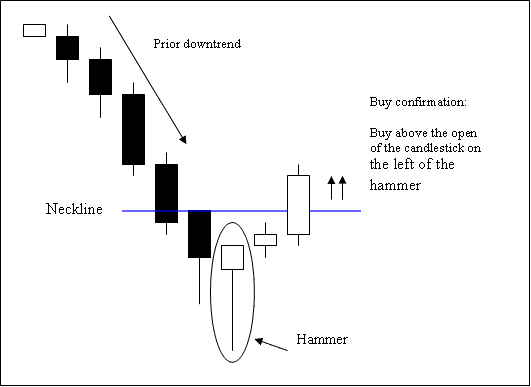
Hammer is a potentially bullish setup which occurs during a downward trend. It's named so because the market is hammering out a market bottoms.
A hammer has:
- A small body
- The body is at the top
- The lower shadow is two or three times length of the real body.
- Has no upper shadow or very small upper shadow if present.
- The color of the body is not important
Hammer Candlestick
Analysis of Hammer Candles Setup
The buy signal is confirmed when a candle stick closes above the opening stock index price of the candle on the left side of the hammer trading candlestick setup.
Stop orders should be set few pips just below the low of hammer candle.

Hanging Man Candlestick
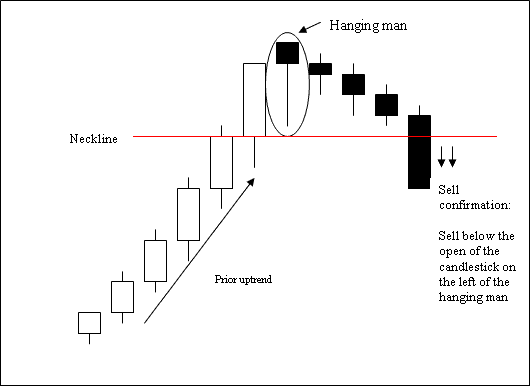
This pattern is a potentially bearish reversal signal that forms during a upward trend. It's named so because it looks like a man hanging on a noose up high.
A hanging man candle has:
- A small body
- The body is at the top
- The lower shadow is two or three times length of the real body.
- Has no upper shadow or very small upper shadow if present.
- The color of the body is not important
Hanging Man Candlestick
Analysis of Hanging Man Trading Candlesticks
The sell trading signal is confirmed when a bearish candle closes below the open of the candle on left-side of this hanging man candlestick setup.
Stop orders should be set a few pips just above the high of the hanging man candlesticks.
What is a Forex Trading Plan? - Written Forex Trading Plan Template
Alternatives: Automated EA Trading Robots or Copy Paste Trading Signals

