Stochastic Oscillator Stock Indices Technical Analysis and Stochastic Oscillator Stock Indices Signals
Developed by George C. Lane
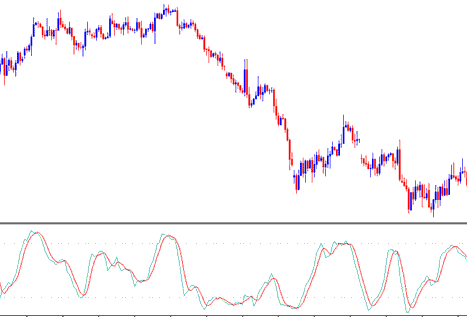
The Stochastic Oscillator is a momentum indicator - it shows the relation between the current closing price relative to the high & low range over a given number of n periods. The Oscillator uses a scale of 0-100 to draw its values.
This Oscillator is based on the theory that in an up stock trend market the price closes near the high of the price range & in a downward trending market the price will close near the low of the price range.
The Stochastic Lines are drawn as 2 lines- %K & %D.
- Fast line %K is the main
- Slow line %D is the signal
3 Types of Stochastics Stock Indices Trading Oscillators: Fast, Slow & Full Stochastics
There are Three types are: fast, slow and full Stochastic. Three indicators look at a given chart period for examples the 14-day period, and measures how the price of today’s close compares to the high/low range of the time period that's being used to calculate the stochastic.
This oscillator works on the principle that:
- In an upwards stock trend, price tends to close at the high of the candlestick.
- In a downwards stock trend, price tends to close at the low of the candlestick.
This technical indicator shows the momentum of the trends, and identifies the times when a market is overbought or oversold.
Technical Analysis & How to Generate Trading Signals
Most common techniques used for analysis of Stochastic Oscillators to generate trading signals are cross overs trading signals, divergence signals & overbought oversold levels. Following are the techniques used for generating signals
Indices Trading Crossover Trading Signals
Buy signal - %K line crosses above %D line (both lines heading up)
Sell signal - %K line crosses below %D line (both lines heading down)
50-level Crossover:
Buy signal - when stochastic lines cross above 50 a buy stock trade signal is generated.
Sell signal - when stochastic lines cross below 50 a sell stock trade signal is generated.
Divergence Indices
Stochastic is also used to look for divergences between this indicator & the price.
This is used to determine potential stock trend reversal signals.
Upward/rising stock trend reversal - identified by a classic bearish divergence
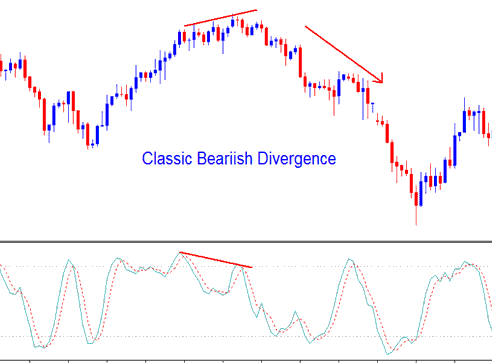
Trend reversal - identified by a classic bearish divergence

Downwards/descending stock trend reversal - identified by a classic bullish divergence
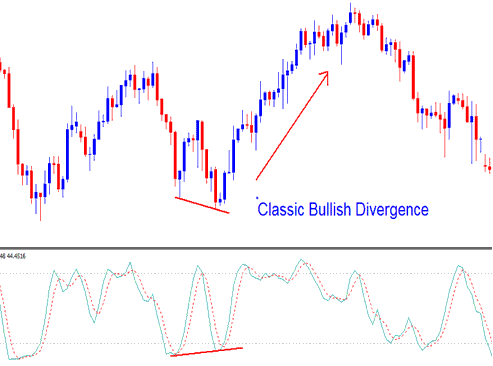
Trend reversal - identified by a classic bullish divergence
Overbought/Oversold Levels on Indicator
Stochastic is mainly used to identify potential overbought & oversold conditions in price movements.
- Overbought values greater than 70 level - A sell signal occurs when the oscillator rises above 70% & then falls below this level.
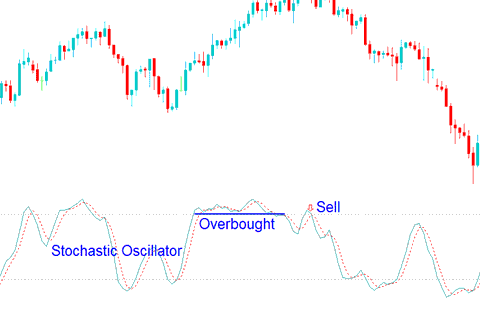
Overbought - Values Greater 70
- Oversold values less than 30 level - a buy trading signal is generated when the oscillator goes below 30% and then rises above this level.
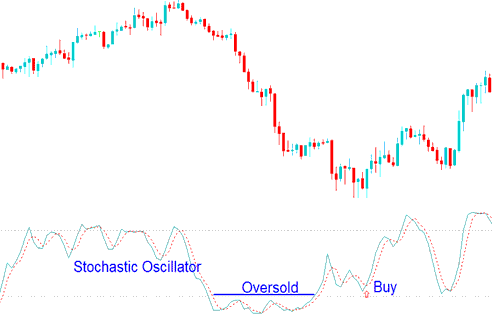
Oversold - Values Less Than 30
Trades are generated when the Stochastic Oscillator crosses these levels. However, overbought/oversold levels are prone to whipsaws especially when the market is trending upwards or downward.
What is a Forex Trading Plan? - Written Forex Trading Plan Template
Alternatives: Automated EA Trading Robots or Copy Paste Trading Signals

