Combining Stochastics with Different Types of Technical Indicators
This tutorial should be called: Combining Stochastics with other Indicators, but Stochastic Stock Indices System sounds real nice.
Stochastic Oscillator technical indicator can be combined with other trading indicators to form a stock indices system. For our example we will combine it with:
- RSI
- MACD
- MAs Stock Indices Trading Technical Indicator
Example 1: Stock Indices Trading Stochastic System
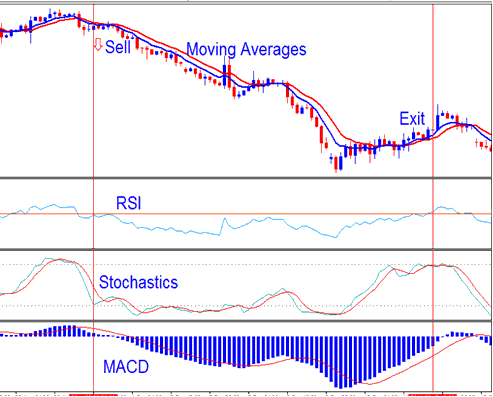
Sell Stock Indices Signal Generated using Stock Indices Trading Stochastic System
From our stock indices system the sell signal is generated when:
- Both Moving Averages are moving down
- RSI is below 50
- Stochastic moving downward
- MACD heading downward below center-line
The sell signal was generated when all these stock indices rules were met. The exit signal is generated when a trading signal in opposite market direction is generated i.e. When the indicators reverse.
Good thing about using such a stock indices system is that we are using different types of stock indicators to confirm the trade signals and avoid as many whipsaws as possible in the process.
- Stochastic - is a momentum oscillator stock index trading technical indicator
- RSI- is a momentum oscillator stock index trading technical indicator
- Moving Averages Indicator- is a trend following trading technical indicator
- MACD- is a trend following indicator
It's very useful to combine more than one stock indicator, as a combination of stock signals is better than relying on just a single stock indicator. The stock index trading indicator combinations reinforce each other, and cancel out false whipsaw stock index trade signals.
A stock trend following indicator helps a trader to see the overall picture, while using more than one momentum stock technical indicator gives better & more reliable entry & exit points for trading stock indices.
The stock indicators combinations & their signals help to decipher a lot of the stock market activity.
Example 2: Stock Indices Trading Stochastic System
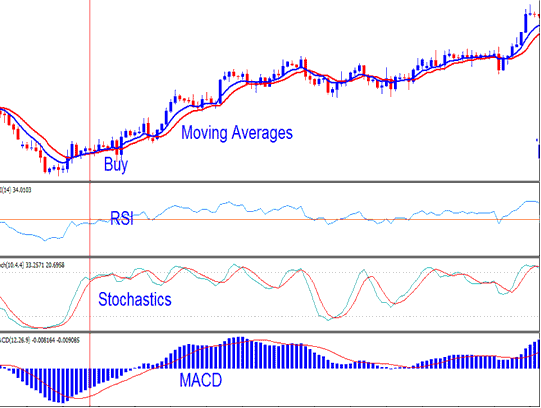
Buy Stock Indices Signal Generated using Stock Indices Trading Stochastic System
For this example the stock trend is clearly upward, but at some point there were a few stock indices whipsaws generated by the stochastic oscillator indicator, can you identify them? - So the question is how can a trader avoid trading these stock indices whipsaws?
Well, the answer is that by looking at the other technical indicators such as MACD indicator a trader could have avoided the whipsaw, even the MACD indicator had not given a cross-over signal although it was very close to the zero center-line level, at the same time the gradient at which moving averages technical indicators turned was not so sharp as to warrant a decisive stock market trend reversal. Well the thing is that it’s not so obvious when it comes to recognizing stock market whipsaws: it is a skill that takes some time but after some time you can spot whipsaws from a mile away.
One tip is that as long as MACD indicator is above zero center-line even if the MACD lines are moving downwards then the trend is still upward. As you can see from the above example MACD indicator never went below zero line and afterwards the upward trend continued with the MACD indicator maintaining above Zero line & continuing to move upwards.
During ranging stock markets Stochastic Oscillator indicator will give the fastest signals which are prone to whipsaws. This is why stochastic oscillator indicator is best combined with other indicators and the stock signals traded are confirmed by another one or two other Indices indicators.
What is a Forex Trading Plan? - Written Forex Trading Plan Template
Alternatives: Automated EA Trading Robots or Copy Paste Trading Signals


