Stock Indices Trading Long and Short and Charts
In stock index trading, there are two types of stock trades, these are:
- Long (buy) - long is if the stock trend is buy/bullish.
- Short (sell) - short is if the stock trend is sell/bearish.
Buying/Long and Selling/short in Stock Indices
Both terms in Stock Indices, refer to things we do when open a stock index trade.
Buying Long - stock indices term to use when buying and when opening a stock index trade.
Selling short - stock indices term to use when selling and when opening a stock index trade.
Long - Long is another term used to refer to buying in stock indices, If a trader opens long it means that he buys the stock indices instrument that is heading in an upward trend direction. When the price is moving in an upward stock trend the trend is referred to as bullish stock index trend.
Short - Short is a term used to refer to selling of a stock indices instrument that is going in a downward trend direction. When the price is going downwards then it is known as to as a bearish stock index trend.
Basically the term, "selling short" can be refer to selling in the stock markets. Selling short is used to trade a stock indices instrument that is predicted to depreciate in its value compared to another, when this stock indices instrument is sold then it is the same as not holding value in this stock index and holding the same value in another form against which this stock indices instrument is traded against - mostly US Dollars.
Buy/Long
If the price is going up we buy, this is referred to as going long - Therefore long is just another term for buy. When the stock market trend is going up it is referred to as bullish, this is when a buy stock trade is placed. A bullish trend is identified by drawing an upwards stock trendline on a chart. The example illustrated below shows a long/buy stock index trade signal.
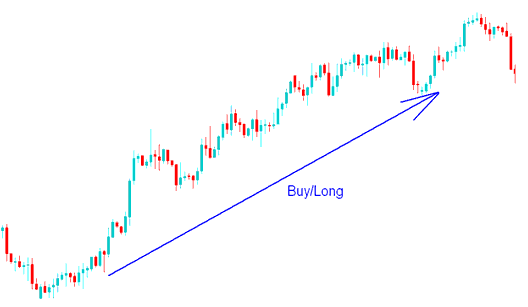
Buy/Long
Sell/Short
If the price pair is heading down we sell, this is referred to as going short. When the stock market trend is going down it is known as to as a bearish. The example illustrated below shows a downward trend, this is when a short sell is placed. The short/sell is identified by drawing a down ward stock trendline on a chart. The example illustrated below shows a short/sell stock index trade signal.
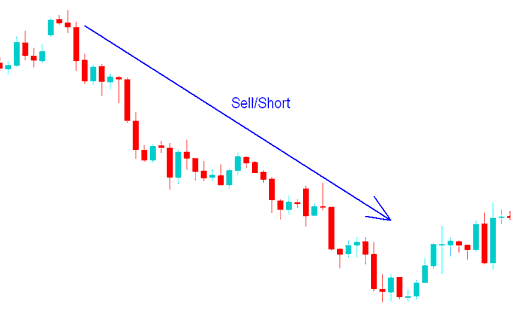
Sell/Short - Stock Indices Buy Trade and Stock Indices Sell Trade

Charts
A chart provides a visual representation of prices (drawn on the y-axis) against time (drawn on the x-axis) for stock indices. The movement of prices is drawn on these stock charts. The stock chart can be drawn as candlestick charts like the one shown below or as line charts or bar charts.
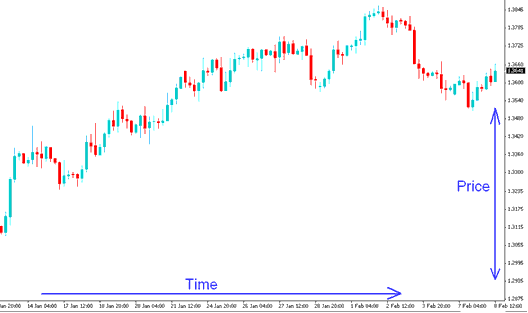
Chart - Candlesticks Charts
The 3 common types of stock charts used in stock index trading are:
- Candles Charts
- Line Charts
- Bar Charts
These 3 are explained in the topic Chart Types.
Platform
This is the stock indices software that is provided by a broker to help stock traders place their stock indices transactions. Once you download and installs this stock indices software on your computer you can then begin to trade in the market. All stock trades are executed through this stock platform. If you want to learn a platform, MT4 Indices Software is a good stock platform to start with.
To set these stock orders, open MT4 Platform, open a 'chart', right click on the "chart', select 'New Order', then select the stock order either sell or buy as revealed below. (Keyboard Short-Cut Keys - Press F9 Key)
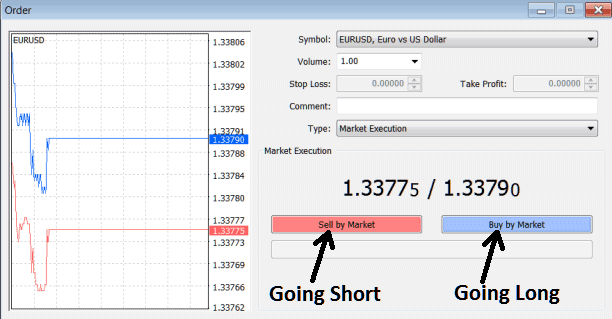
Setting Buy Long Order and Sell Short Order on MetaTrader 4
What is a Forex Trading Plan? - Written Forex Trading Plan Template
Alternatives: Automated EA Trading Robots or Copy Paste Trading Signals

