Stop Loss Stock Indices Order Trading Summary: Points To Remember When Placing
The key to placing top loss orders in stock index trading isn't to set too tight or too far & not exactly on the support or resistance areas.
A few pips below support or above the resistance zones is the best place.
If you are going long (buying a stock indices instrument), just look for a nearby support level which is below your entry point & set this order about 10 pips to 20 pips below that support level. The example illustrated below show the level where a trader can set their stop loss orders just below the support level on a chart.
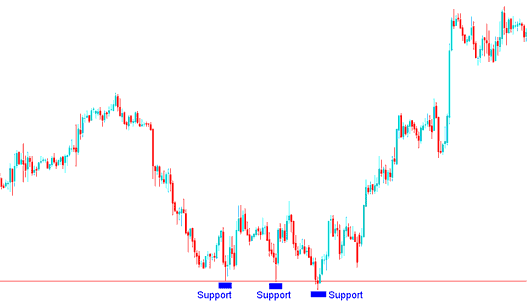
Support Level for Placing Stop Loss Stock Indices Order Level for Buy Trade
If you are going short (selling a stock indices instrument), just look for a nearby resistance level that is above your trade entry point and put this top loss order about 10 pips to 20 pips above that resistance level. The example illustrated below show the level where a trader can set their stop loss orders just above the resistance level on a chart.
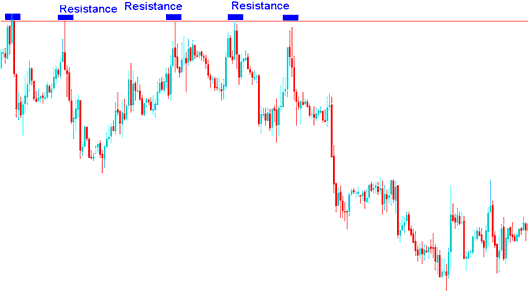
Resistance Level for Placing Stop Loss Stock Indices Order Level for a Sell Trade
You can also use stop loss orders to lock in trading profits, Not for just Preventing Losses
The advantage of a stop loss order is that you do not have to monitor the market on a daily basis how the market is performing. This is especially handy when you are in a situation which prevents you from watching your positions for an extended period of time, or when you want to go to sleep after trading the whole day.
The disadvantage is that the price at which you set these orders could be activated by a short-term fluctuation in price. The key is picking a stop loss order percent which allows price to fluctuate within the day to day range while capping the down side risks.
These stock orders are traditionally thought of as a way to cap losses thus the name. Another use of these stop loss orders is to lock in profits, in which case it's referred to as a trailing stop loss.
For a trailing stop order it is put at a percent level below the current market price. This trailing level then shifted as the trade transaction unfolds. Using a trailing stop loss level allows you to let the profits run while at the same time ensures that should the stock market turn you will have locked in some of your profits.
These stock orders can also be used to eliminate risk if a trade position becomes profitable. If a trade transaction makes some substantial gains then the stop loss order can be moved to break even point, the point at which you opened buy, thereby ensuring that even if the trade position goes against you, you will not make any loss, you will break even on that trade.

Trailing stop orders are used to maximize & protect profit as price rises and cap losses when the price falls.
A good example is when you use the parabolic SAR Indicator & keep moving your stop order to the parabolic SAR level.
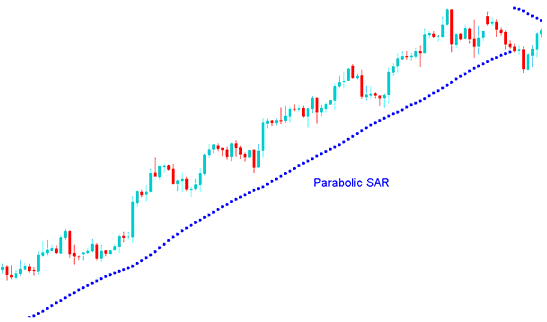
Parabolic SAR Stock Indices Indicator for Setting Trailing StopLoss Order in Stock Indices
Another example is where one moves his stop loss order by a certain number of pips after every few hours or after each hour or after every 15 min depending on the Stock Indices chart time frame which the trader is using.
In the stock example above the parabolic SAR Indicator which had a setting of 2 & 0.02 was used as the trailing stop loss for the above chart. The trader would have kept moving the trailing stop loss order level up after every SAR was drawn until the time when the Parabolic SAR was hit and the stock trend reversed.
ConclusionA stop order is a simple trading tool, yet so many investors fail to use it. Whether it's used to prevent excessive losses or to lock in profits, nearly all investing styles can benefit from this tool.
Points To Remember When Putting These Stop Orders
Here are some important points to remember:
- Be careful with the points where you set these stop orders. If a stock indices instrument normally fluctuates 20 points, you don't want to put your top loss order too close to that range else you'll be taken out by normal market volatility
- Stop Loss Stock Indices Orders take the emotion out of a trading decisions and by setting one you set a pre determined point of exiting a losing trade, meant to control losses.
- Traders can always use indicators to calculate where to put these regions, or use the concepts of Resistance and Support to decide where to set these stop loss orders. Another good indicator used to put these stop loss orders is the Bollinger bands where traders use the upper & lower band as the limits of price therefore putting these orders outside the bands.
What is a Forex Trading Plan? - Written Forex Trading Plan Template
Alternatives: Automated EA Trading Robots or Copy Paste Trading Signals

