How to Open a New Stock Index Trade Chart on Trading Software
As a trader before opening a new trade you need to open a chart of the particular Indices that you want to trade so that you can first of all analyze the market moves & then decide whether to open a buy or a sell trade.
To open a trade on your trading software follow the steps below
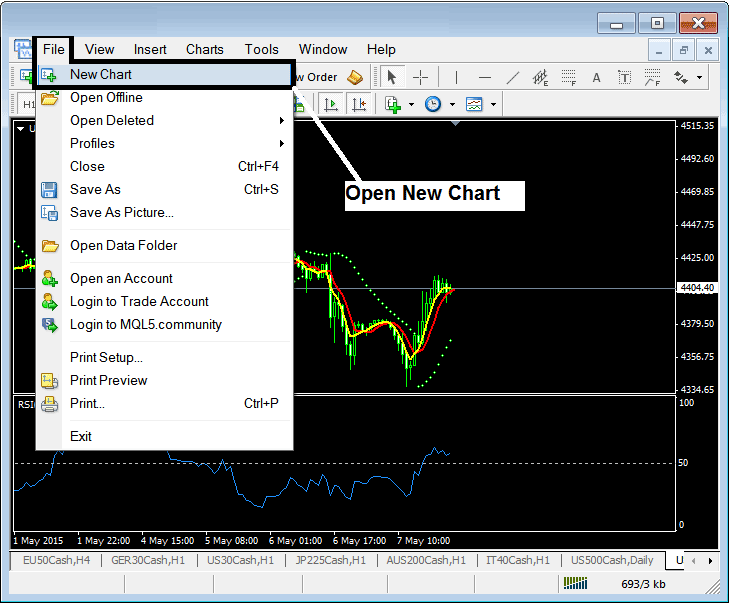
Once a trader chooses the open 'New Chart' button, following sub menu will appear where a trader can select the chart they want to open, if the chart is not on the list the trader should select the groups & search within which group the particular chart they want to trade is located, for our example the group named "Group 6" contains all the Stock Indices that we are interested in Indices Trading - you can find all the charts of Stock Index here.
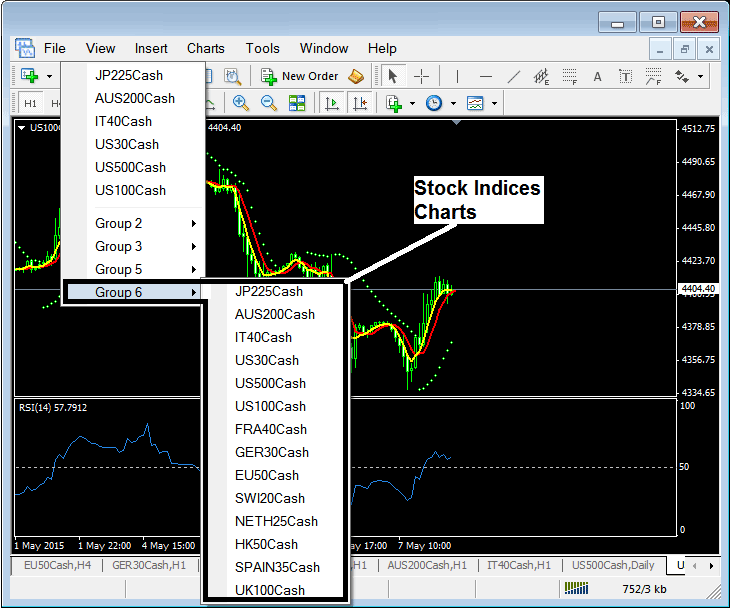
As a trader you can select any Stock Index from the above menu named group 6 & all Stock Indices are listed here.
Method 2: Where to Find Indices
Another method of where to find Stock Indices is to use the "Market-Watch" window as is shown below.
To show market-watch use the button key shown below or press the keyboard shortcut key CTRL+M
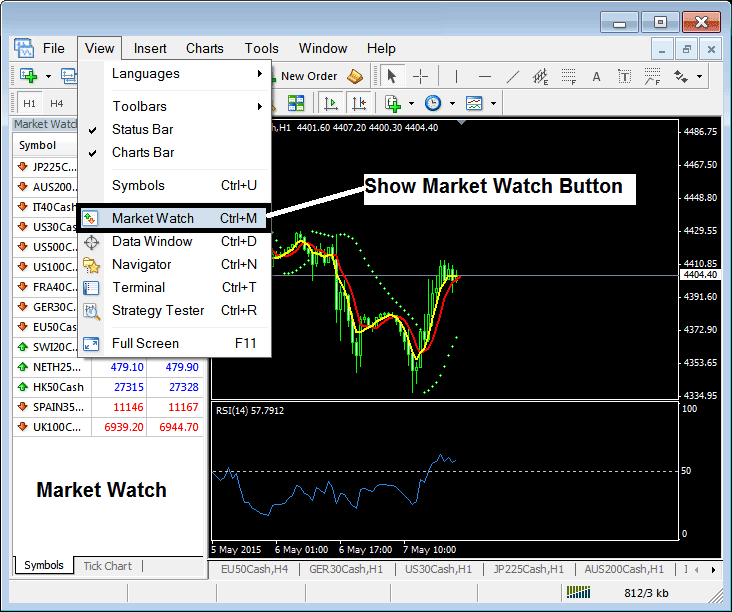
The Market-Watch pop up window will appear as shown above with all the listed trading Stock Index as shown above.

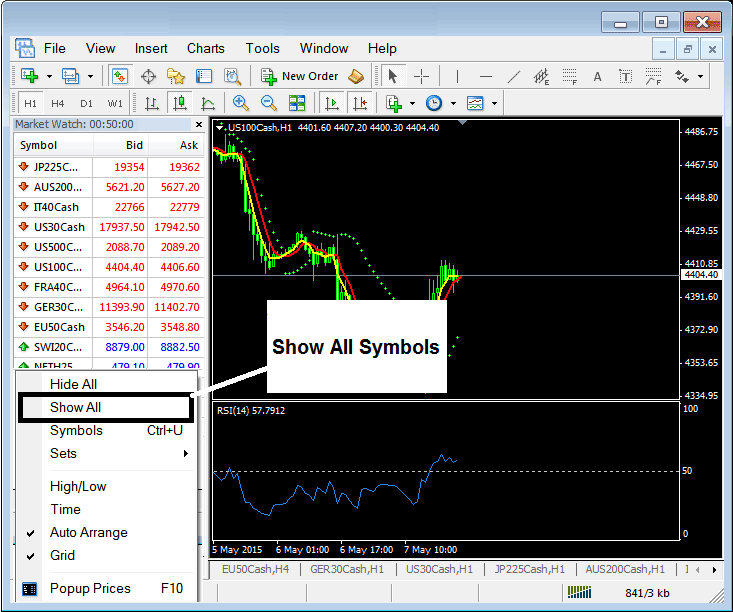
However, sometimes all the Stock Indices might not be listed, if the Stock Indices that you want to trade is not shown on the above list you can use the following steps to show all the available charts.
1. Click anywhere inside the Market-Watch widow
2. Select the option 'Show All'
All the instruments available for trading will be shown and from this list you can select the particular Indices that you want to trade and after choosing, click again within the Market-Watch window & this time select 'Hide All', this option will hide all the instruments that you are not trading therefore saving your internet bandwidth.
From the above trading symbols of Stock Index shown on the Market-Watch you can right-click any symbol and then select the option "Chart Window" & the chart for that particular Indices will be open on the platform workspace and you can then place indicators on this chart, analyze the market movement & also place new orders from the chart.
Method 3: How Do You Access Stock Indices Symbols?
A trader can also use the 'View' menu next file, once a trader goes on the view menu, trader can then select the option "Symbols" as is shown below.
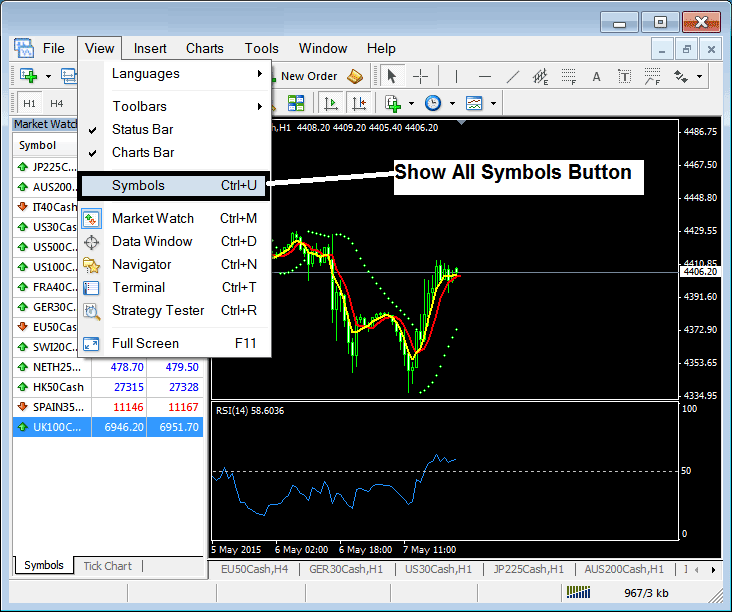
After choosing the symbols button the following popup pop up window will appear showing all the available Groups of trading instruments, for our example we want Group 6 instruments, expand this group 6 by clicking the + plus button, a list of all symbols of Stock Index will appear, choose any of the Stock Indices that you want to add in the Market-Watch window & then click the "Show" button as illustrated below.
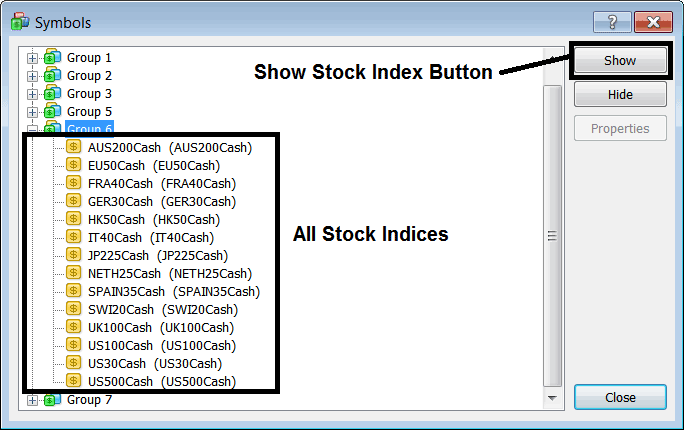
After adding all the Stock Indices symbols that you want you will then click the close button key as shown above and all the symbols for Indices will now be listed on the Market-Watch window & you can open trading charts that you want from the Market-Watch window.
What is a Forex Trading Plan? - Written Plan Template Example
Alternatives: Automated EA Robots or Copy Paste Signals

