How Do You Trade Online Indices?
By now you have learned all the basics required for starting Stock Indexes & you have setup the trading platform, opened a demo account & learned about the trading platform. The next step is to learn how to trade Stock Indices & how to analyze indices to determine whether to buy or sell a particular Indices.
When to Open a Buy or Sell Trade
As a trader you will need to come up with a method that will determine when you'll open a buy trade and when you'll open a sell trade. The way to do this is to come up with a trading system - a trading system is a set of rules that you will use to determine when you'll open a trade.
Indices Trade System
For this tutorial we shall come up with a simple trading system that will show you the rules that you will use to open your first trades.
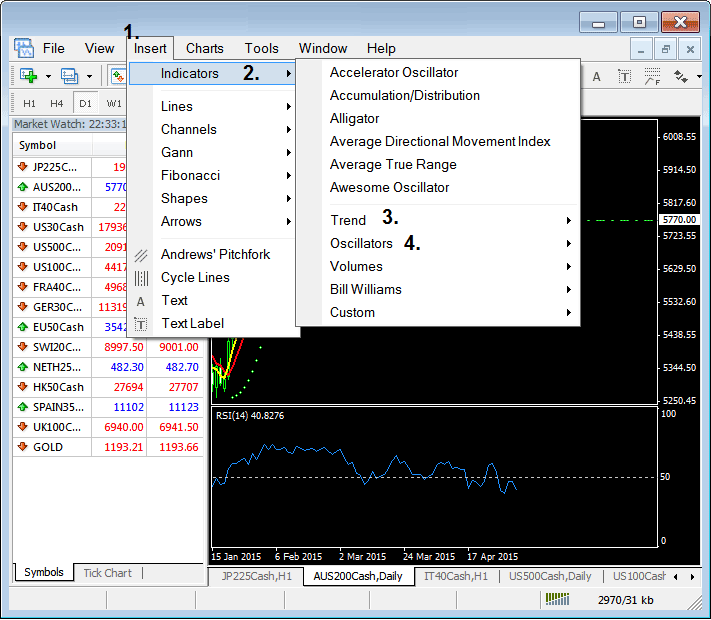
For our trading system we shall use two indicators, Moving Average Indicator & the RSI Indicator. These are commonly used indicators & if you want to know where to find them on your trading platform, then you can go to the insert menu as is illustrated below: Just click 1. Then click 2. And then click 3 & 4 & you'll find these two indicators - once you click on them they will be placed on the charts.
Once you have inserted the indicators the trading system will look like the example below.
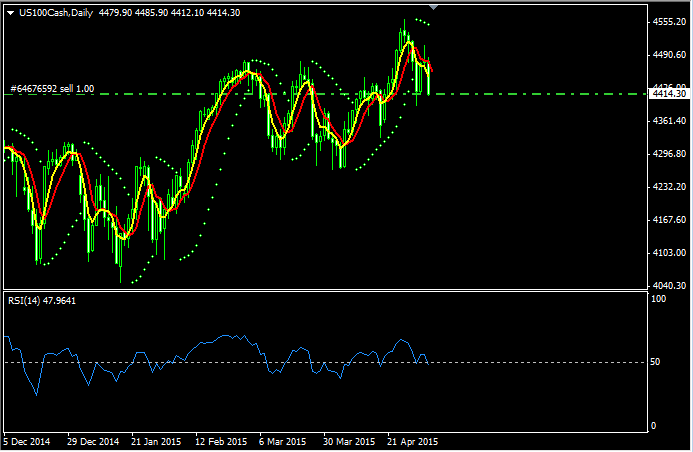
The above trading system is using the following indicators:
1. MA Moving Average 5 - yellow line
2. MA Moving Average 7 - red line
3. RSI 14
The rules below are used to generate buy & sell trades:
Buy Trade Rules
1. Both MAs Moving Averages are moving upward
2. RSI is above the 50 center line mark
Sell Trade Rules
1. Both MAs Moving Averages are moving downward
2. RSI is below the 50 center line mark
As an explanation the when 2 moving averages are used this is known as the moving average crossover system and a signal is generated when both moving averages are moving in the same direction either up or down.
For RSI the 50 center line mark is used to generate trading signals, this 50 level is marked as shown above, when the RSI is above 50 mark it show prices are closing higher than they opened and when RSI is below 50 it shows prices are closing lower than they opened.
This two explanation form the basis of our above trading system, let us now look at 2 examples one for generating a buy trade and the other for generating a sell trade.
Buy Trade Signal
For this buy trade we shall look at an earlier trade that had been setup previously using this trading system, but for our sell example we shall open a real time market trade and wait to see how the signal plays out, but for now let us look at the buy trade.
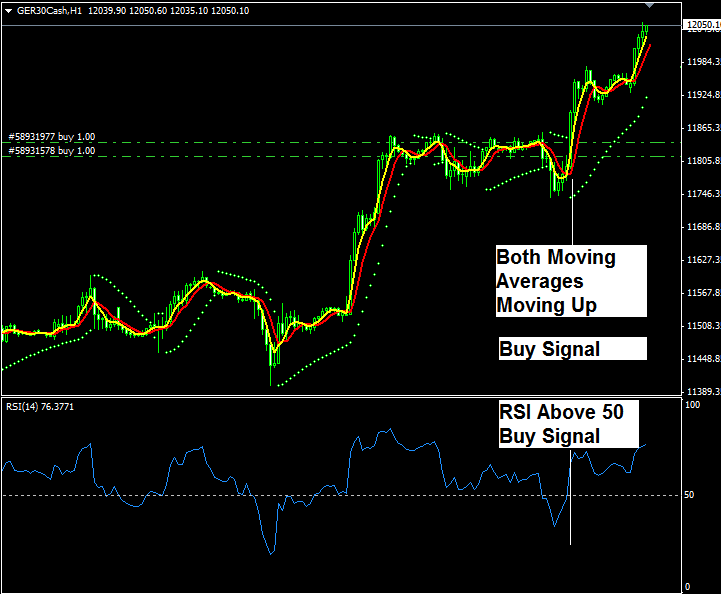
For the above trade our buy trades were opened when the 2 buy rules were met, buy trades were placed where the green dotted lines are - the two buy trading signals are explained on the chart above.
For the Moving average the place where the 2 moving averages started to move upwards on the chart are market & this is where our buy signal was generated.
To confirm this signal we used a second indicator, RSI indicator which also confirmed the buy signal when the RSI line moved above the 50 center line mark, this is when as a trader you would have opened your buy trade because the two indicators used in our trading system have both given a buy signal.
Take Profit - As a trader you also need to know when to close you open trades & take the profit. For this trade this is the point where we closed our trade, trade had been in the market for 18 hours & we did not want to leave our trade open overnight, so we closed our trade after a nice profit & continued trading the next day.
Remember as a day trader you do not want to leave you trades open overnight, always open and close all trades within the day, close your trade go to sleep & wait to open other trades the next day.
From the example you can see that even when this trade was closed the market was still moving up but it is good not to be too greedy & always book profits while still ahead. Taking profits fast is one of the factors that will determine if you make money or not when trading indices it is best to always take your profit at the end of every day & continue trading the following day, every day there is always a Stock Indices that provides a good opportunity to make profit.
Sell Trade
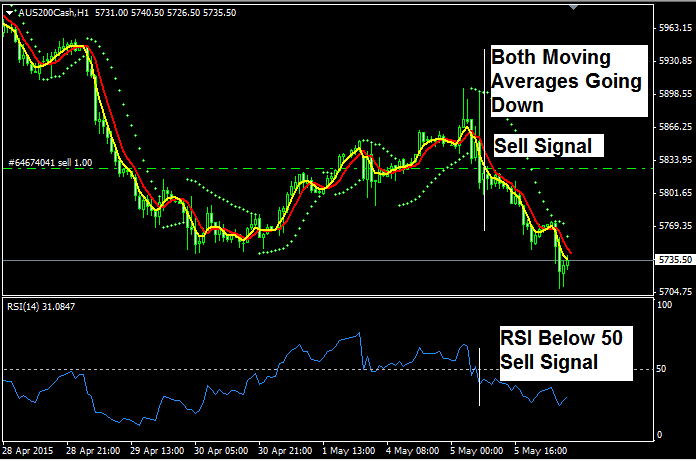
For our sell trade we open a real time market trade and give it time to develop so that as to make profit.
This sell trade has been opened because our sell trading signals have been met; these are both moving averages are moving downward & the RSI has confirmed this sell signal because it's below the 50 center line mark showing that the market trend is downward.
Saving a Trading System - About Trading Templates
Once you come up with the above trading system, you will need to save it that way you quickly load the same setup on another chart without having to choose all these indicators every time you open a new chart.
To do this you will use the " Save Template " option on your Indices platform as shown below:
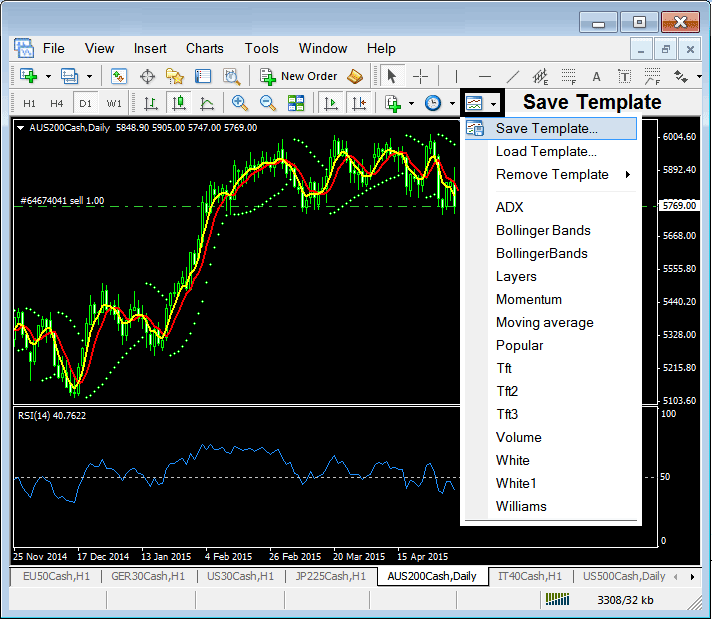
From the above template button key you can save as many trading systems as possible and use the same shortcut on your platform to load these trading systems on other charts that you open using the " Load Template " button.


