NASDAQ 100 Stock Index
NASDAQ 100 is an index that include 100 of the largest companies shown in the NASDAQ Stock Indexes exchange market which are not in the financial sector. The calculation of this stock index is based on weighted factor of market capitalization of listed 100 securities. The 100 companies shown on this index are reviewed quarterly.
The 100 companies used to calculate this index are not necessarily based in USA: foreign international companies are also included as long as they are listed in the NASDAQ Bourse.
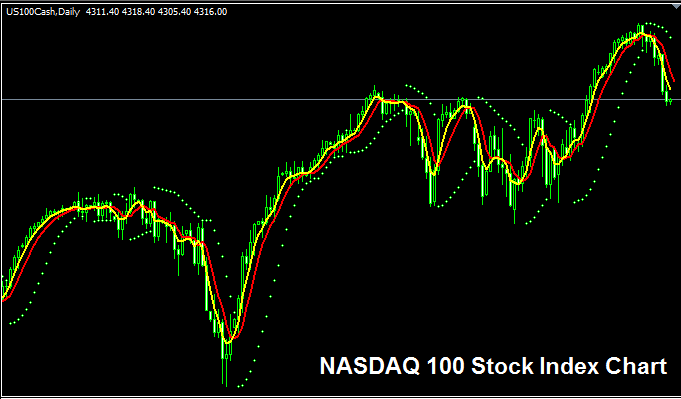
The NASDAQ 100 Stock Index Trade Chart
The NASDAQ 100 Stock Index trade chart is shown and illustrated above. On the above example this Stock Indexes is named US 100CASH. As a trader you want to find a broker that provides NASDAQ 100 Stock Index trade chart so that you can start to trade it. The Stock Indices example above is of NASDAQ 100 Stock Indexes on the MetaTrader 4 Forex & Indices Trading Software.
Other Information about NASDAQ 100 Stock Index
Official Symbol - QQQ:IND
The 100 components stocks that makes up NASDAQ 100 Stock Index are calculated using a weighted factor for each stock. The component stocks & weighting for each Stock Indexes is reviewed quarterly.
Strategy for Trading NASDAQ 100 Stock Index
NASDAQ 100 Stock Index method of calculating makes it more volatile & therefore there are more wide swings in price movement of this stock index. The Index has a weighting factor for each Stock Indexes included on this index. Although this stock index in general moves upward over longterm because the American economy also shows strong growth.
As a trader you want to be biased and keep buying as the stock index moves upward. When the America economy is doing well, stocks that makes up NASDAQ 100 index will keep gaining in values & thus this stock index is likely to keep heading in an upward trend. A good trading strategy to trade this Stock Index would be to buy dips.
During Economic SlowDown and Recession
During economic slowdown and recession times, companies begin to report lower profits & lower growth prospect. It is because to this reason that traders begin to sell stocks of companiesthat are reporting lower profits & therefore the Stock Indices tracking these specified stocks will also begin to move downwards.
Therefore, during these times Stock Indexes trends are likely to be heading downward & you as a trader should also adjust your strategy accordingly to suit the prevailing downwards trends of the stock index that you are trading.
Contracts & Specifications
Margin Required Per Lot - $ 30
Value per Pips - $ 0.1
NB: Even though general trend is generally upward, as a trader you have to consider & factor in the daily market volatility, on some of the days the Stock Indices might move in a range or even retrace and pullback, Stock Indices market retracement move may also be a significant one at times & therefore as a trader you need to time your trade entry precisely using this trade strategy: Stock Indexes trading strategy & at same time use proper money management guidelines just in case there is more unexpected volatility in the market trend. About money management methods in indices trading topics: What is Stock Indexes money management & Stock Indices money management methods.


