S & P 500 Index - Standard & Poor's 500 Index
The Standard & Poor's 500 Index is a Indices that keeps track of the capitalization of 500 stocks that represent major industries in American economy. The list of 500 companies is made up of stocks shown in NYSE and NASDAQ.
The S&P 500 just like the Dow Jones Industrial Average Stock Index is more volatile than most of the other Top Stock Indices, The S&P 500 index will over long-term trend upward but it will have more price pullbacks & more consolidations than other Indices. Traders may prefer to trade other indexes other than this one if they are more accustomed to trading more stellar trends found in other top stock indices.
One of the reason this stock index has more oscillations than other indexes is because it has more constituent stocks than other indexes. This Stock Index also has a weighting factor in its calculation which also contribute to making it more volatile.
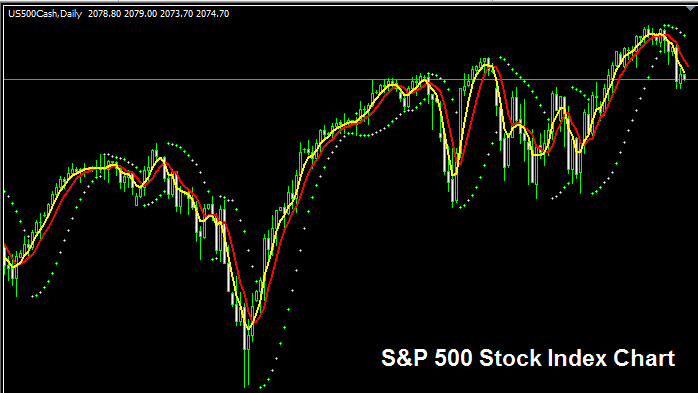
The S and P 500 Index Trading Chart
The S&P 500 Index trading chart is shown and illustrated above. On the above example this instrument is named US 500CASH. As a trader you want to find a broker that provides S&P 500 Index trading chart so that you can begin to trade it. The example above is of S&P 500 Stock Indices on MT4 Forex and Trading Software.
Other Information about S and P 500 Index
Official Symbol - SPX:IND

The 500 component stocks that makes up S&P 500 Index are chosen from the major industries in American economy. The calculation of this stock index is however different compared to other Stock Indices; the price component of the 500 stocks also has a weighting factor that makes this stock index more volatile than others.
Strategy for Trading S and P 500 Index
The S&P 500 Index method of calculating makes it more volatile & therefore there are more wide swings in price movement of this stock index. Although this stock index in general moves upward over long-term because American economy also shows strong growth & is also the largest economy in the world.
As a trader wanting to trade this stock index, be prepared for wider price swing & a little more volatility.
As a trader you want to be biased & keep buying as the index moves upward. When America economy is doing well (most of the times it is doing well) this upwards trend is more likely to be ruling. A good trade strategy would be to buy the dips.
During Economic Slow-Down & Recession
During economic slow-down & recession times, companies begin to report lower profits & lower growth prospect. It is because to this reason that traders begin to sell stocks of companiesthat are reporting lower profits & therefore Indices tracking these specified stocks will also begin to move downward.
Therefore, during these times trends are likely to be moving downward & you as a trader should also adjust your strategy accordingly to suit the prevailing downwards trends of the stock index that you are trading.
Contracts & Specifications
Margin Requirement Per Lot - $ 12
Value per Pips - $ 0.1
Note: Even though general trend is generally upwards, as a trader you have to consider & factor in daily market volatility, on some of the days the Indices might move in a range or even retrace and pull-back, the market retracement move might also be a significant one at times & therefore as a trader you need to time your trade entry precisely using this trade strategy: Stock trading strategy and at same time use proper money management guidelines just in case there is more unexpected volatility in the market trend. About money management methods in stock indices trading topics: What is Stock Index money management & Indices money management methods.
What is a Forex Trading Plan? - Written Plan Template Example
Alternatives: Automated EA Robots or Copy Paste Signals

