S&P/ASX200 Index
The ASX200 Stock Indices tracks top companies in Australia Bourse. The total number of stocks used to calculate this stock index is the 200 top Australian companies represented in the ASX200. This Stock Indexes is calculated based on capitalization of included companies & it is reviewed quarterly.
Even though this stock index is calculated based on capitalization, it does not track capitalization; it tracks changes in Indices prices of various components stocks in this stock index.
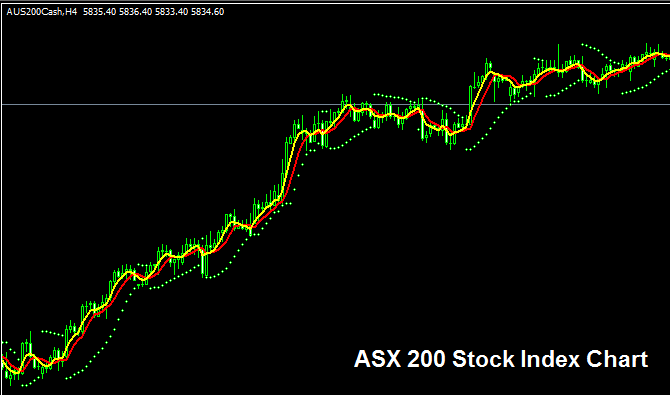
The ASX200 Index Trading Chart
The ASX200 Index trading chart is shown and illustrated above. On the above example this instrument is named AUS 200CASH. As a trader you want to find a broker that provides ASX200 Index trading chart so that you can begin to trade it. The Indices example above is of ASX200 Stock Indices on MT4 Forex and Stock Indices Trading Software.
Other Information about ASX200 Index
Official Symbol - AS 51:IND
The 200 component stocks that makes up ASX200 Index are selected from the top Australian companies measured by capitalization. This Stock Indexes has a base up on which the calculated total market capitalization is adjusted relative to this base - the calculation also has a divisor that means that this Stock Indexes will only reflect a change in movement only when the share prices move up & not when market capitalization does, therefore, this index show the difference in the share prices rather than the total market capitalization. This is because the base represents the starts value of all share prices & when this stock index is calculated it tracks the total change in the share prices.
Strategy for Trading ASX200 Index
The ASX200 Index will generally move up because share prices always move upward over time. This Stock Indexes in general moves upward over long-term because Australian economy also shows strong growth backed by their mining sector which has great reserves of Gold & other valuable commodities.
As a trader wanting to trade this Stock Indexes, the Indices will move upward faster when the Australian economic indicators show accelerated economic growth.
As a trader you want to be biased & keep buying as the index moves upward. When Australian economy is doing well (most of the times it is doing well) this upwards trend is more likely to be ruling. A good stock indices trade strategy would be to buy the dips.
During Economic Slow-Down & Recession
During economic slow-down & recession times, companies begin to report lower profits & lower growth prospect. It is because to this reason that traders begin to sell stocks of companiesthat are reporting lower profits & therefore Indices tracking these specified stocks will also begin to move downward.
Therefore, during these times Stock Indexes trends are likely to be moving downward & you as a trader should also adjust your strategy accordingly to suit the prevailing downwards trends of the stock index that you are trading.
Contracts & Specifications
Margin Requirement Per Lot - AUD 70
Value per Pips - AUD 0.1
Note: Even though general trend is generally upwards, as a trader you have to consider & factor in daily market volatility, on some of the days the Indices might move in a range or even retrace and pull-back, the Indices market retracement move might also be a significant one at times & therefore as a trader you need to time your trade entry precisely using this trade strategy: Stock index trading strategy and at same time use proper money management guidelines just in case there is more unexpected volatility in the market trend. About money management methods in stock indices trading topics: What is Stock Indexes money management & Indices money management methods.


