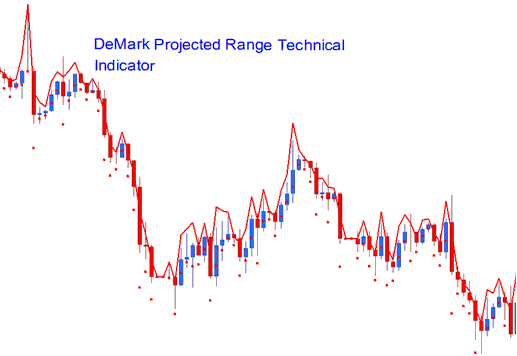
DeMark Projected Range Stocks Analysis & DeMark Projected Range Stocks Signals
Created by Tom Demark.
This stocks indicator is used to signal the potential high and low stocks prices that a stocks chart price is likely to reach.
This is referred to as the range projection and it is calculated using the open and the close stocks prices of the most recent stocks price period.

DeMark Projected Range
Stocks Analysis & How to Generate Signals
This stocks indicator will show two points, the projected high and the projected low of a specific stocks price period. This will be used as the reference point.
Bullish Up stock trading trend Signal
If the next stocks price bar opens above the projected high then the stocks market will continue in an upwards Stocks trend.
Bearish down stocks trend Signal
If the next stocks price bar opens below the projected low then the stocks market will continue in a downwards Stocks trend.
Ranging Stocks Market
If the next stocks price bar opens within the projected range, then this is a signal that the stocks market will remain in a range base.
