Insert Andrew's Pitch Fork, Cycle Lines, Text & Text Label on Stock Chart
The last 4 options on the MT4 stock trading software insert menu are:
- Andrew's Pitch Fork
- Cycle Lines
- Text
- Text Label
These are pictured below:

Insert Menu Options in Meta Trader 4
Andrew's Pitchfork
The Andrew's Pitchfork is plotted between three points first point is mid point of stocks price, the next is the upper point of stocks price & the third is lower point of stocks price. This draws three parallel lines that form a channel. Stocks Price should stocks trend within this channel, if stocks price moves outside of this channel like in stocks example shown & described below the trade should be closed.
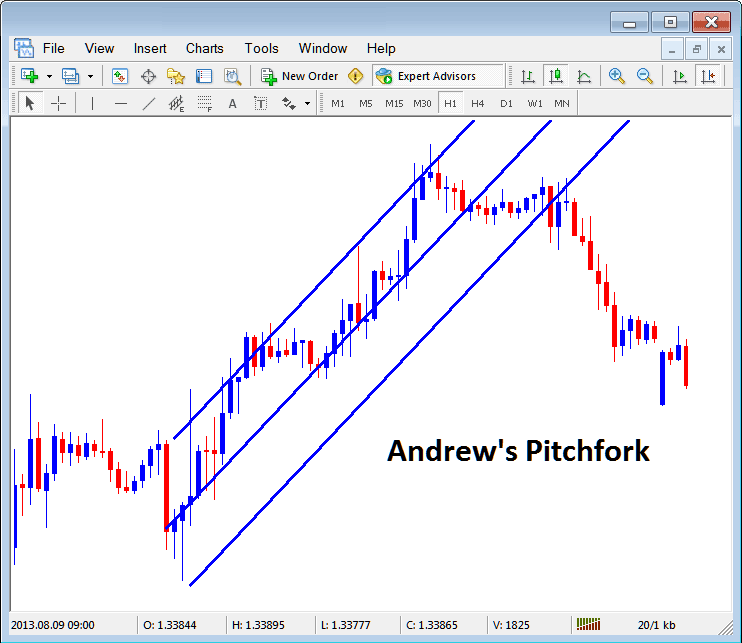
Andrew's Pitchfork in Meta Trader 4

Cycle Lines
Cycle lines are vertical lines drawn at an equal distance representing market trading cycles. To draw these lines one selects one continuous stocks trend & draws a line between the high & low of the stocks trend and then this MT4 technical indicator automatically plots the cycle line, these lines represent market cycles.
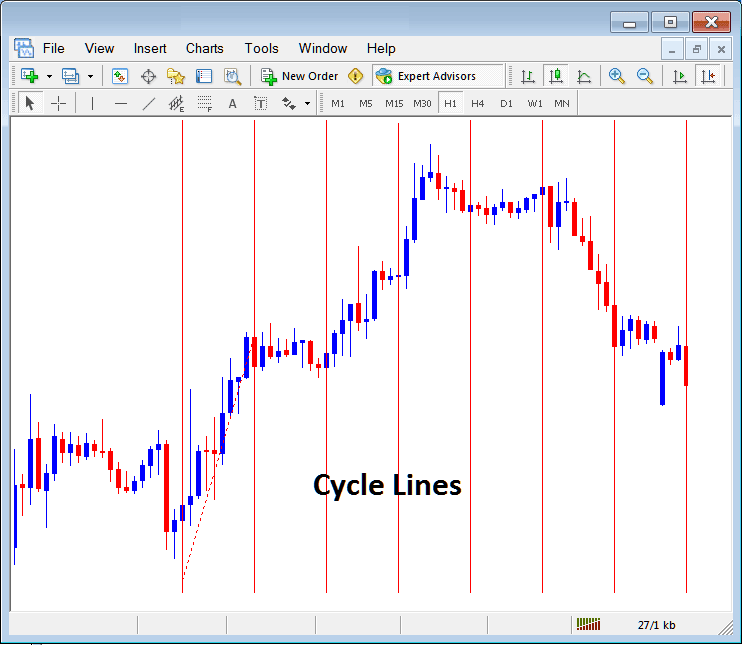
Cycle Lines MT4 Technical Indicator
Text & Text Label
As a trader you might want to mark a stocks price level on your stock trading chart. To do this you can use either the text or text labels, Choose any of this button key, choose where to place these labels after which a popup appears prompting you to input the text of the label. To edit the text label double click on it and then this pop up will appear again & edits can be made on this window.
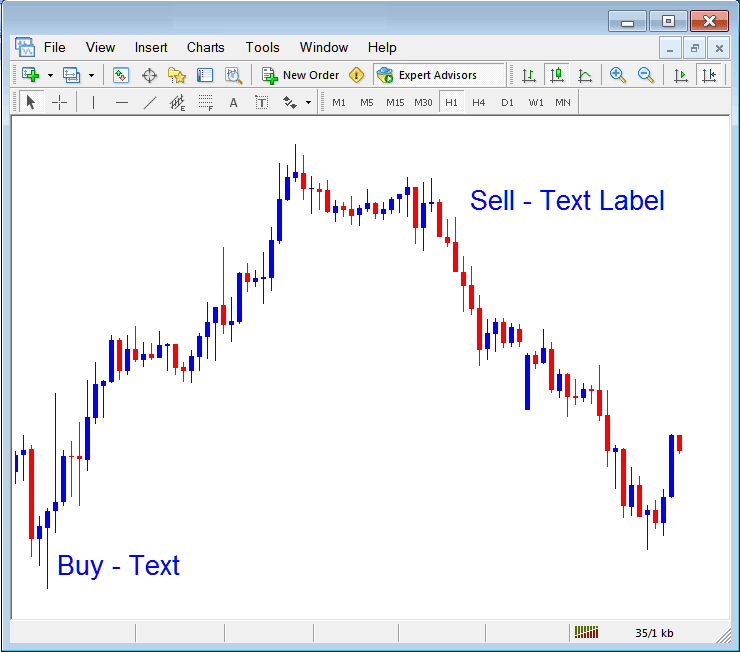
Text and Text Labels in Meta Trader 4
From the above example the buy is a text & the sell is a text label, both aren't much different only that the text will move with the chart, while the text label is fixed at one point & will not move with the chart.