MACD Gold Strategies
- MACD Fast Line and Signal Line
- MACD Buy & Sell Trading Signals
- MACD Whipsaws FakeOut Signals
- Generating Centerline Crossover Signals
- MACD Classic Bullish and Bearish Divergence
- MACD Hidden Bullish & Bearish Divergence
- MACD Summary
Bullish & Bearish XAUUSD Signals
The MACD ranks as one of the most common indicators. It acts as a momentum oscillator with trend-following traits.
MACD is a very well-known and favored tool that people use when examining and making sense of trading data. MACD makes signals by using points where lines intersect.
The MACD illustrates the divergence and convergence of moving averages. It is formulated through Moving Average analysis. The Moving Average Convergence/Divergence is a technical indicator that follows trends. MACD reveals the relationship between two moving averages.
One MA is of a shorter period & the other for a longer period of the price bars.
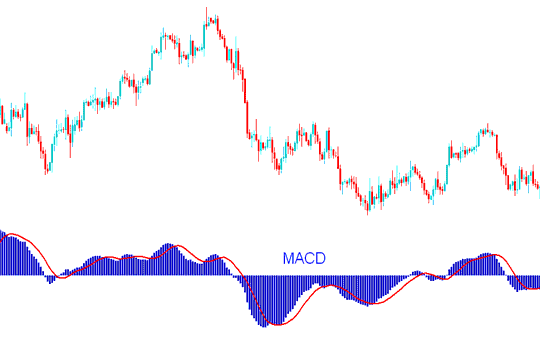
MACD Indicator - MACD Indicator Analysis
The MACD features a zero center-line: values above the zero line indicate a bullish trend, while those below signify a bearish trend.
In an rising trend the shorter MACD line goes up quicker than longer MACD line creating space. Also while the MACD stays over the center-mark the trend is still positive like shown and described below.
Don't sell if the MACD Indicator is above the Center Mark - that means prices are likely to go up. It doesn't matter which way it's moving as long as it's above the zero center line, as you can see in the example below.
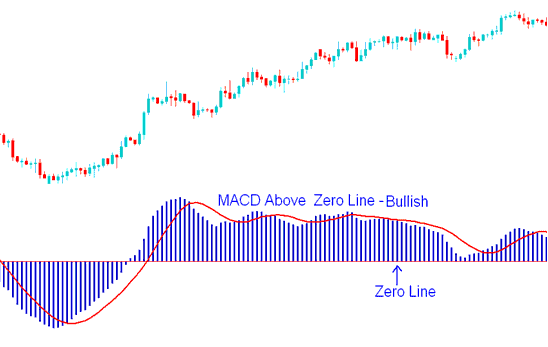
MACD Indicator Above Zero Mark - Bullish XAUUSD Signal
During a downward trend, the shorter MACD line declines more rapidly than the longer MACD line, creating a gap. Additionally, as long as the indicator remains below the center mark, the trend continues to be bearish, as illustrated below.
Refrain from initiating a buy trade while the MACD Indicator remains beneath the central Zero Line - this zone signifies bearish conditions, irrespective of the indicator's movement as long as it stays below that zero mark, as demonstrated in the trading example below.
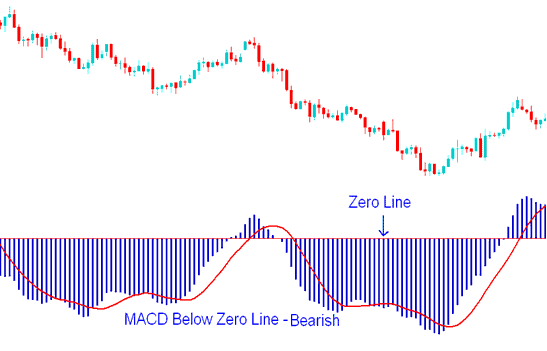
MACD Indicator Below Zero Center Line Mark - Bearish XAUUSD Signal
As the market trend nears a turning point and reversal, the lines on the MACD oscillator begin to converge, effectively reducing the space between them.
Get More Courses:
- RSI Index Trading Divergence
- Window Menu for Charts
- How Do You Place NZD CHF Symbol to MT4 Software/Platform?
- AUD NZD Spread
- MT4 Forex Platform Work Space
- What is Minimum Amount to Trade SWI 20 Indices?
- Regulated Trading Forex Broker Review
- How is SX 5E Index Traded in the MT4 & MetaTrader 5 Platform?
- GBPNZD Open Time and GBPNZD Close Time
- What's FX and the FX Market Trade Sessions Explained?