Stochastic Oscillator Expert Advisor Setup - Setting Up Stochastic Oscillator EA
Stochastic Oscillator Indicator Expert Advisor Setup - Setting Up Stochastic Oscillator Indicator Expert Advisor - A trader can come up with an Stochastic Oscillator Indicator Expert Advisor based on the Stochastic Oscillator Indicator explained below.
Stochastic Oscillator Indicator Expert Advisor rules can be combined with other technical indicators to come up with other EA Forex Robots that trade using rules based on two or more indicators combined to form a trading system.
Stochastic Oscillator Indicator
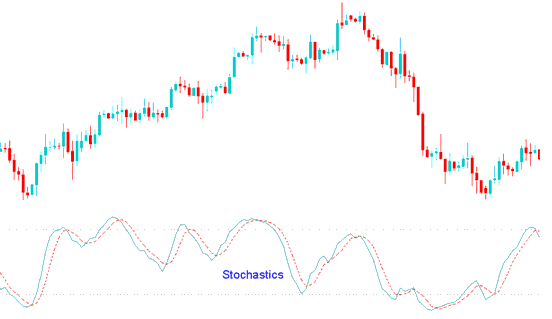
This is a momentum indicator designed to show the relation of the current close price relative to the high/low range over a given number of periods using a scale of 0-100. It is based on the assumption that in a rising market the price(s) will close near the high of the range and in a declining market the price(s) will close near the low of the range.
There are typically plotted as 2 lines: %K and %D. %K is the main (fast) line and %D is the signal (slow) line.
Explanation
There are three basic techniques for using the various Stochastic Oscillators to generate trading signals.
Stochastic OscillatorCrossovers:
1. %K line / %D line Crossover: A buy signal occurs When the % K line crosses above %D line & a sell signal occurs when the %K line crosses below %D line.
2. %K line / 50-level Crossover: When the % K line crosses above 50 a buy signal is given. Alternatively, when the %K line crosses below 50 a sell signal is given.
Stochastic OscillatorDivergence:
Looking for divergences between the Oscillator and price can prove to be very effective in identifying potential reversal points in price movement. Trade long on Classic Bullish Divergence: Lower lows in price and higher lows in the Oscillator; Trade short on Classic Bearish Divergence: Higher highs in price and lower highs in the Indicator.
Overbought Oversold Levels:
The Stochastic Oscillator can be used to identify potential overbought and oversold conditions in price movements. An Overbought level is generally described as the indicator being greater than or equal to the 80% level while an oversold level is generally described as the level being less than or equal to the 20% level. Trades can be generated when the stochastic crosses these levels. A buy signal occurs when the levels declines below 20% and then rise above that level. A sell signal occurs when the levels rise above 80% and then decline below that level.

Stochastic Oscillator - Stochastic Oscillator Indicator Expert Advisor Setup
