Relative Strength Index RSI Analysis and RSI Signals
Created and devised by J. Welles Wilder, extensively explained within the volume titled "New Concepts in Technical Systems."
The Relative Strength Index, recognized as a widely favored indicator, serves as both a momentum oscillator and a trend-following technical tool. RSI assesses the magnitude of recent price increases in comparison to the size of recent losses, plotting this data on a scale that spans from 0 to 100.
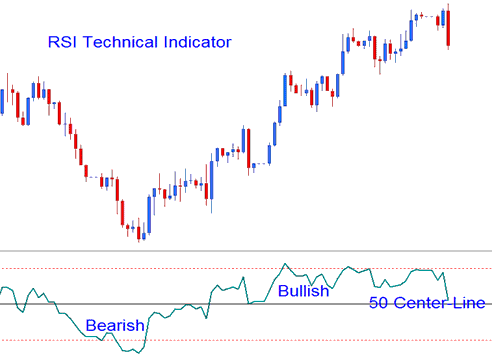
The Relative Strength Index is utilized to gauge the underlying momentum of a currency pair: readings above the 50 midline indicate buying pressure (bullish energy), whereas readings below 50 denote selling pressure (bearish energy).
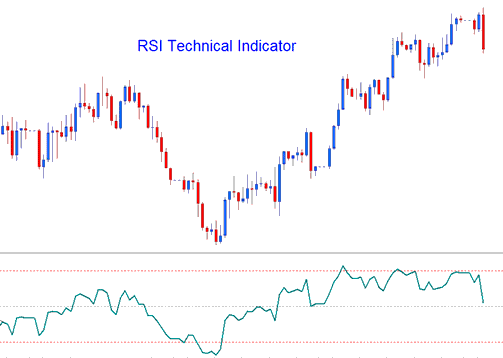
- RSI is drawn as a green line
- Horizontal dashed lines are plotted & drawn to identifying overbought and oversold levels are - 70/30 levels respectively.
Forex Analysis and How to Generate Signals
There are various techniques used to trade, these are:
50-level Cross-over Signals
- Buy trade signal - when the indicator crosses above 50 mark a buy/bullish signal is generated.
- Sell Signal - when the trading indicator crosses below the 50 mark a sell/bearish signal is generated.
RSI Trading Patterns
Traders are able to plot trend lines and map out visible chart formations directly onto the RSI indicator. The Relative Strength Index frequently develops patterns like the head and shoulders, which may or may not be clearly discernible on the primary price chart.
Forex Support/Resistance Break Outs
RSI is a leading indicator & can be used to predict the Support and Resistance Break Outs before price breaks its support/resistance level. RSI technical uses the swing failure signal to predict when the price is about to break support and resistance zones.
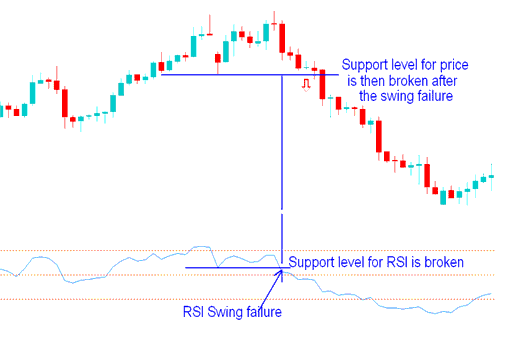
Swing Failure - Support and Resistance Break-out
Over-bought/Oversold Conditions in Indicator
- Overbought levels above 80
- Over-sold - levels below 20
You can use these levels for forex signals. Buy when RSI rises from under 20 after being oversold. Sell when it drops below 80 after overbought. But they create many false signals in forex.
Divergence Forex Setups
Divergence trading is a technical analysis method used to trade trend reversals. It includes four types of divergences, explained thoroughly in the divergence guide available on this website.
More Tutorials & Courses:
- Aroon XAU/USD Indicator Technical Analysis on XAUUSD Charts
- Best Time for Transacting EUR/PLN EST
- Understanding a FX Candlestick Chart Guide Lesson
- Combining Stochastic XAUUSD Indicators XAUUSD Strategies
- How to Interpret/Analyze MetaTrader 4 Charts Explained Beginners Guide Lesson
- Gold News Strategy
- How Do I Count Pips on MT4 for Cent Account Trade Cent Lots?
- What is NKY225 Pips Value?
- What is GBP/NOK Spreads?
- What is Choppiness Index Indicator?