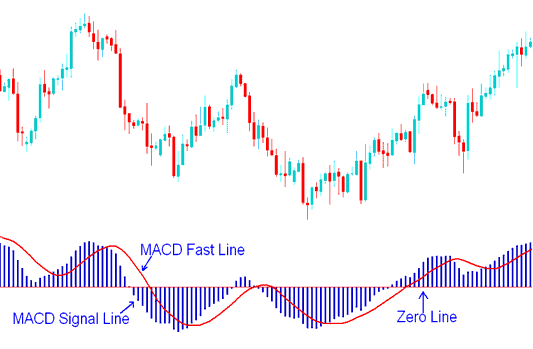
MACD Oscillator Technical Analysis Fast Line & SignalLine
MACD is used in various ways to give analysis data.
- MACD center line crosses show bearish or bullish markets: below the zero is bearish, above zero is bullish.
- MACD Cross-overs indicate a buy or sell signal.
- Oscillations can be used to indicate oversold and over-bought regions
- Used to look for divergence between price and indicator.
Construction of MACD Indicator
The MACD is created using two exponential moving averages and features two drawn lines. The default settings use the 12- and 26-period exponential moving averages, along with a 9-period smoothing factor.
Summing up how MACD gets made
MACD relies on two EMAs plus a smoothing element (12 and 26 exponential MAs with 9 periods for smoothing).
The MACD features only two lines: the MACD fast line and the MACD signal line.

MACD Lines - MACD Fast-Line & MACD SignalLines Signals
- The FastLine is the difference between the 26 EMA & 12 EMA
- The Signal-line is the 9 period moving average of MACD fastline.
Implementation of MACD Indicator
MACD implements the MACD line as a continuous line while the signal-line is implemented as a histogram. These 2 MACD LINES are then used to generate signals using the crossover strategy method.
There is also the MACD center line, which is also called the zero mark, and it is a point where buyers and sellers in the market are balanced.
Values that exceed the center mark are interpreted as bullish signals, whereas those that fall below are seen as bearish signals.
MACD being an oscillator technical indicator, oscillates above and below this center line.
Study More Subjects and Tutorials
- How to Use MetaTrader 4 Relative Vigor Index RVI Indicator
- What is US TEC 100 Pips Value?
- How Can I Use MetaTrader 4 Kase DevStop 2 Trading Indicator?
- NKY225 Stock Index Market Index Trading Strategy
- CHF/SGD FX Pair
- Forex Divergence Trading Setups of M-Shapes Price Highs and W-Shapes Price Lows
- How To Trade XAU USD
- UsTec 100 Trading Indicator MetaTrader 4 Indicators
- EURCAD System EURCAD Trade Strategy
- What You Should Know About FX: Advantages and Disadvantages

