Chart Time Frames for Trading Stock Indices
When it comes to trading Stock Index you will have to decide which trade chart time frame is best for your strategy. This will depend on what type of trader you are & what your profit objective is.
There are 4 types of trading styles & the style of trading that you choose is what will determine what chart time frame you will use when trading.
The 4 styles of trading are:
1. Scalping
2. Day trading
3. Swing trading
4. Position trading
Scalping
Scalping is a trading method where a traders trades big lots & aims to profit from small market movements. The scalper then opens & closes trades quickly - typical trades last from a few seconds to a few minutes usually less than 10 or less than 5 minutes for some. For example a scalper may trade lot sizes of 50 lots & aim for take profits of 10 to 20 points. Because in Indices there is the fractional points or fractional pips 10 points will become 100 points because the last added point denotes a fraction.
This typical trade will be kept open for only a short while & the stops used are very tight, a scalper will only set their stops at about 5 or 6 or 7 pips, this means that most of the time scalpers trade fast moving markets so that when they open a trade it is more likely to go in their favor very quickly and hit their take profit. Scalpers do not keep their trades open for very long & they use the 1 minute chart time frames so that to capture the quick market moves. Scalpers will also make many trades per day usually 30 to 50 trades per day. This method of trading requires those traders that can make decisions very quickly.
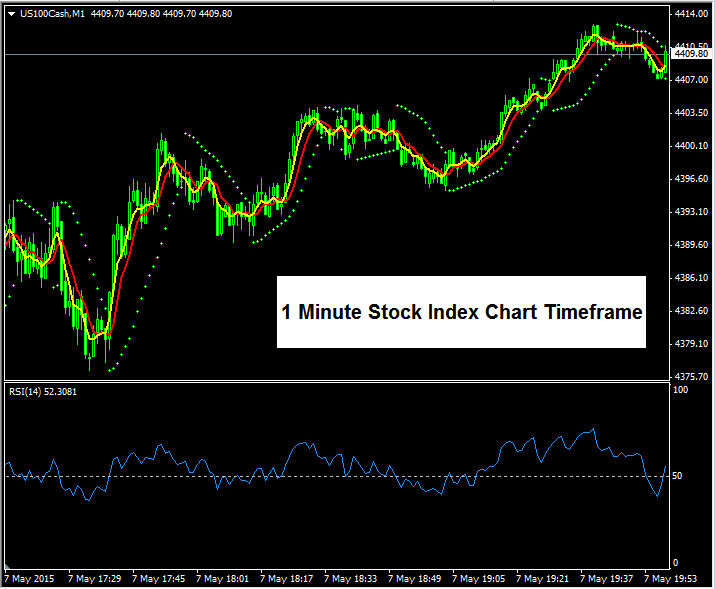
1 Minute Stock Index Trading Chart Time frame for Trading
Day Trading
Day trading is the most popular trading method among all other trading methods, maybe scalpers may disagree but day trading is the most popular. In day trading the traders will open trades with modest amount of lots & they aim to take profits from the intra-day trends which may move an average of 40 to 70 points. The day traders will open about 2 or 3 or 5 lots per trade & will set take profit targets of about 30 points up to 50 points. Day traders will aim for this number of pips every day and will only open 1 or 2 or 3 trades per day and not more. Day traders will also close all their trades at the end of the day even if their profit targets have not been reached; they close all their trades & wait to open others the following day. This is why this group of traders are called day traders - they only trade during the day and close all their trades at the end of the day.
Day Traders use intra-day charts such as 15 minutes, or 1 hour chart depending on the time they spend on trading & also depending on which chart generates the best trading signals based on their trading system. If you want to become a day trader you will have to practice with both of these chart time frames so that to decide which chart time frame is best for you. Some day traders are faster than other & these ones prefer the 15 minute chart time frame, others are slower & prefer the 1 hour chart time frame.
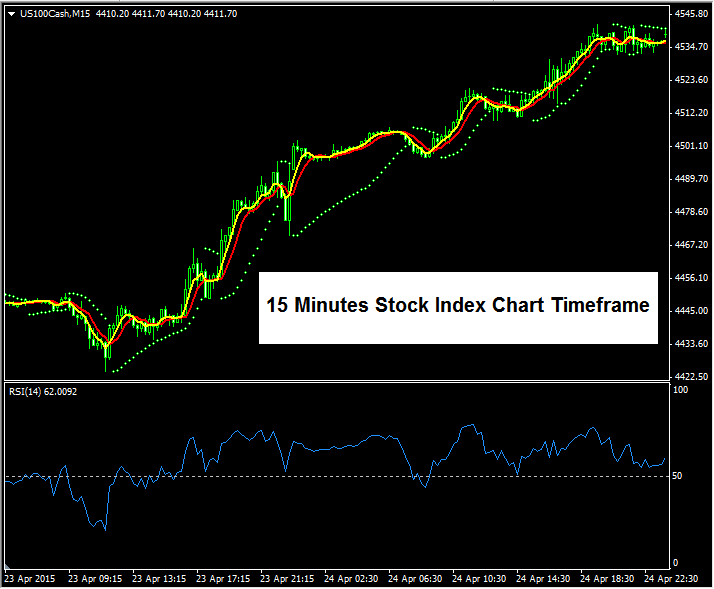
15 Minute Stock Index Trading Chart Time frame - Day Trading
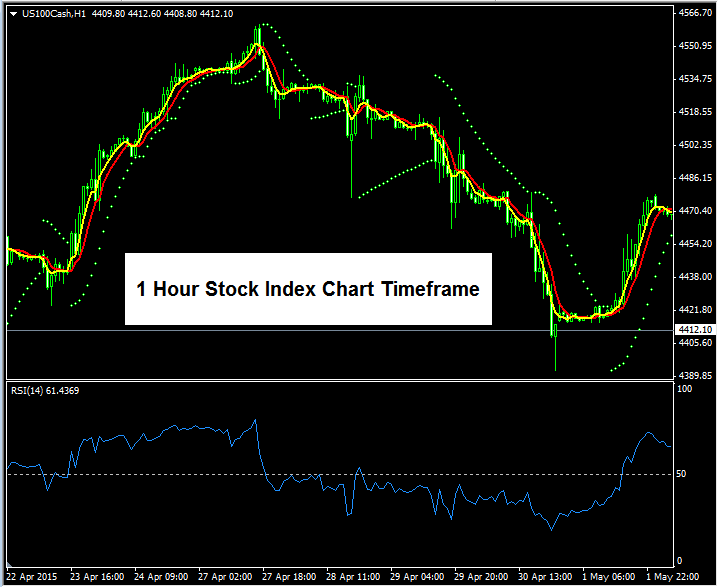
1 Hour Stock Index Trading Chart Timeframe - Day Trading

Swing Trading
Swing trading method is where trades open & hold trades for a few days so that to let their trades catch extra momentum & extra pips in profit. Swing traders will leave their trades open overnight - and unless you know what you are doing as a beginner please leave these method to those who know what they are doing, leaving your trades open overnight is never a good idea as you are taking too much risk as the market may reverse on your trades. Swing traders will use the 4 hour charts so that to determine the medium market trend & open trades that will be in the direction of this medium term trend. These trades will last from 3 to 5 days. Swing traders will open lot sizes of 1 or 2 or 3 lots & their trade will stay open for a few days. Day traders will only open 1 or 2 or 3 trades per week & will spend most of their time monitoring their open trades rather than placing trades.
For this method the trader is ready for wide market swings, therefore the name swing trading.
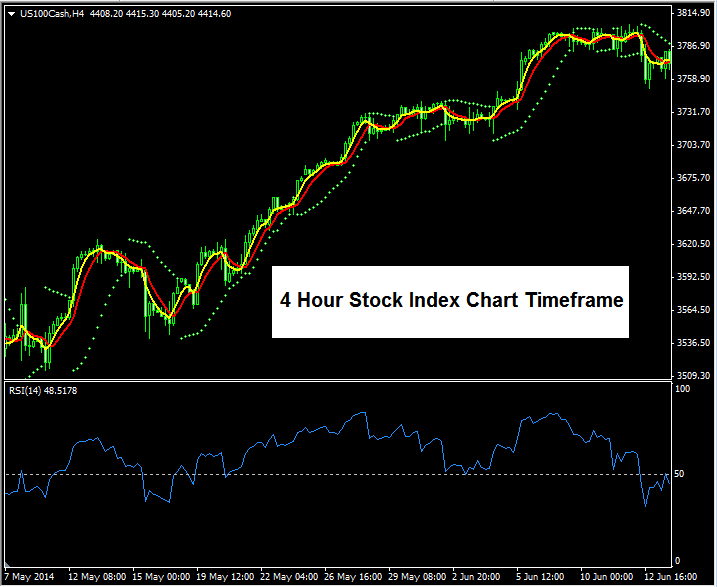
4 Hour Stock Index Trading Chart Time frame - Swing Trading
Position Trading
Position trading is the least popular method of all in trading, position trading is more of an investing strategy rather than trading - this method uses the daily and weekly trading chart time frames to catch long term trends & the position trader then opens trades & keep these trades open for months or even years so that to catch the momentum of the long term trend. This method is also prone to wide market swings & sometimes the market may retrace all the profits made by a trader & that is why this method is the least popular method when it comes to trading, hardly any trader trades using this method.
Where to Find Chart Time Frames on the Stock Indices Trade Software
To set your chart time frame you will use the "Charts" menu next to file, view and choose the option marked "Periodicity" as shown below.
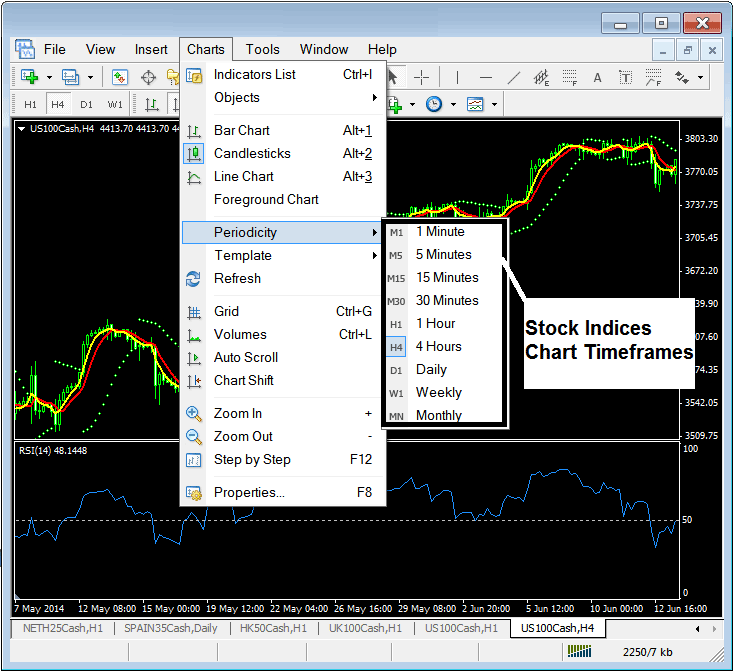
From the above periodicity menu a trader can change the chart time frame to any chart time frame that they would like to trade. The current set time frame is always highlighted, for example the above chart is the 4 hour chart - on the periodicity menu the 4H next to the 4 hour chart is highlighted.