Morning star candlestick pattern - Engulfing Candle-sticks Patterns
Morning Star Bullish Candlestick - Evening Star Bearish Candlestick - Bullish and Bearish Engulfing Candlesticks Pattern
Morning Star Candle
Morning star candlestick pattern
Analysis of Morning Star Trading Pattern
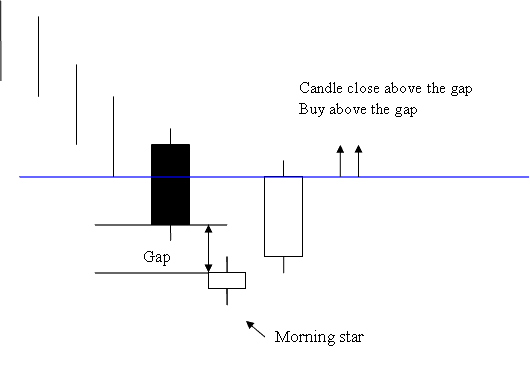
Morning star candlestick pattern is a 3 day bullish price reversal trading pattern.
The first day features a long black candlestick.
The second day forms a morning star. It gaps down from the long black candlestick.
Third day is a long white candle that fills the gap.
The filling of the gap and the closure of the white candle above the market gap serve as a strong bullish signal.
Open a buy after price closes above the morning star gap. This confirms the buy signal from the morning star candlestick pattern.
Evening Star Trading Candle-stick
The inverse of the pattern known as the morning star.
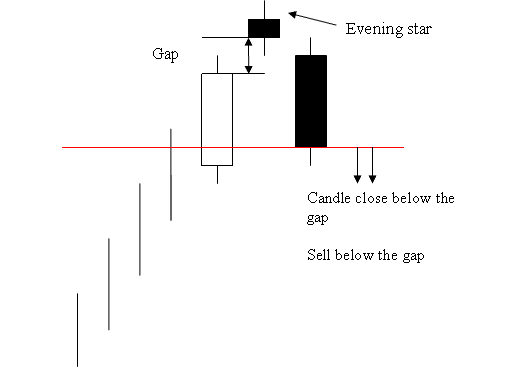
Image of Evening Star on a Chart
Analysis of Image of Evening Star on a Chart
Evening star candle pattern is a 3 day bearish market reversal trading pattern.
The initial day features a long white candlestick.
The second day is evening star that gaps away from the long white candlestick.
On the Third Day, a Long Red Candle Covers the Gap.
A gap fill with a black candle close below it signals strong bearish action.
Traders and Investors should open/execute a sell position once the market closes below the trading gap formation of the evening star. This is confirmation signal of a sell signal generated/derived by this Evening star candlestick pattern.
Engulfing Pattern
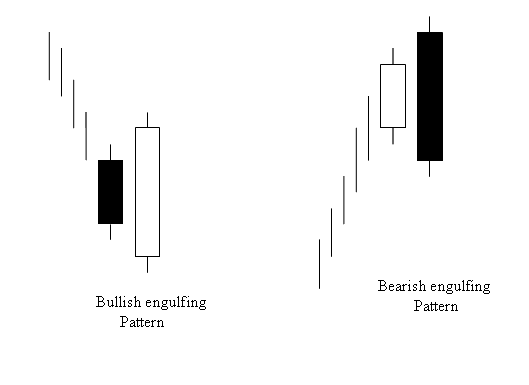
Engulfing is a reversal candle pattern. It can be bearish or bullish, depending on whether it appears at the end of a downtrend or an uptrend.
Bullish and Bearish Engulfing Patterns Explained
Analysis of Bullish and Bearish Engulfing Candlestick Patterns
The color of the first candlestick reflects the market trend of the day.
The second candlestick should completely engulf the first candle & the candle-stick should have the in the opposite trend colour.
Bullish Engulfing Candle Needs a Blue Color for the Bar
Bearish Engulfing Candlestick Appears Red in Color
Access Extra Tutorials and Lessons
- Bullish Hidden Divergence & Bearish Hidden Divergence Forex
- Triple Exponential Average XAU USD Technical Indicator Analysis
- What is Gann HiLo Activator Indicator?
- How to Find and Get Expert Advisor Bot for Trading
- Two XAU USD Methods That are Most Often Used
- How to Use MetaTrader 4 Ehlers Fisher Transform Technical Indicator
- Bollinger Band Double Tops and Double Bottoms Trend Reversal
- How to Add Ehlers Fisher Transform Technical Indicator in Chart
- NOK/JPY FX Pair