Fibonacci Stock Exercises
These exercises will give more example on retracement & expansion. first exercise is to figure out the direction of the Stocks trend & then determine if Fibonacci tool used is retracement or expansion and then figure how it is drawn then practice drawing them on a stocks trading chart.
Tasks:
- Figure out the direction of the Stocks trend
- Determine if the Fib is retracement or expansion
- Figure how it is drawn
- Practice plotting retracement or expansion on a stocks trading chart.
To find a stock trading chart just Download MetaTrader 4 platform from any one of the many stocks brokers.
After you have downloaded MT4, Navigate to the menu 'insert' at top left corner, on the drop down menu, click Fibonacci & select either the option of retracement or expansion. Then plot it as described in the previous tutorials of Expansion & retracement. Then do the following exercises:
Retracements and Expansions Exercise
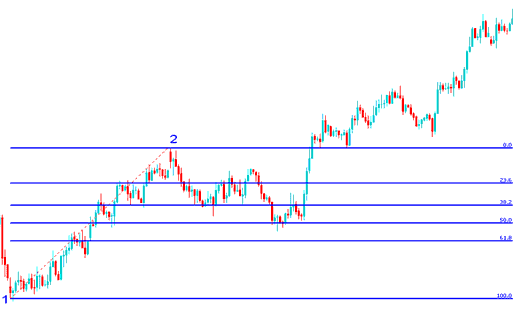
Exercises 1:
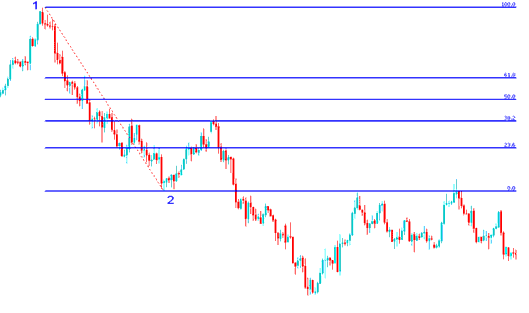
Exercises 2:
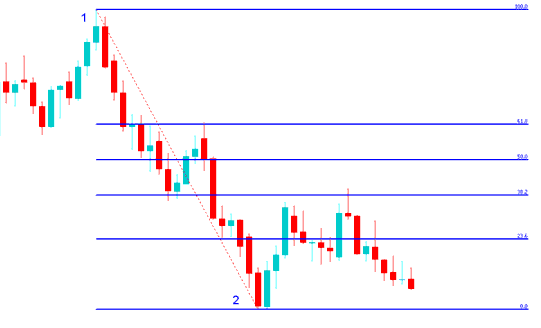
Exercises 3:


Exercises 4:
Exercises 5:
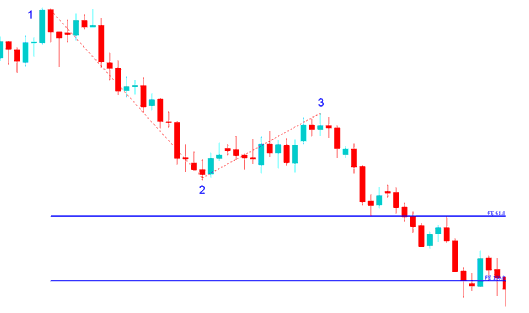
Hint: point 1 to point 2 follows the stocks trend direction
Hint: Retracement has points 1 and 2
Hint: Expansion has point 1, 2 & 3